# Objective

- It isn't very useful to be able to enable feature `trace_chrome` on its own

## Solution

- Enable `trace` feature when enabling `trace_chrome` or `trace_tracy`


Co-authored-by: François <8672791+mockersf@users.noreply.github.com>
3 KiB
Profiling
Runtime Flame Graph: tracing spans
Bevy has built-in tracing spans to make it cheap and easy to profile Bevy ECS systems, render logic, engine iternals, and user app code. Enable the trace cargo feature to enable Bevy's built-in spans. You also need to select a tracing backend using the following cargo features:
Backend: trace_chrome
cargo run --release --features trace_chrome
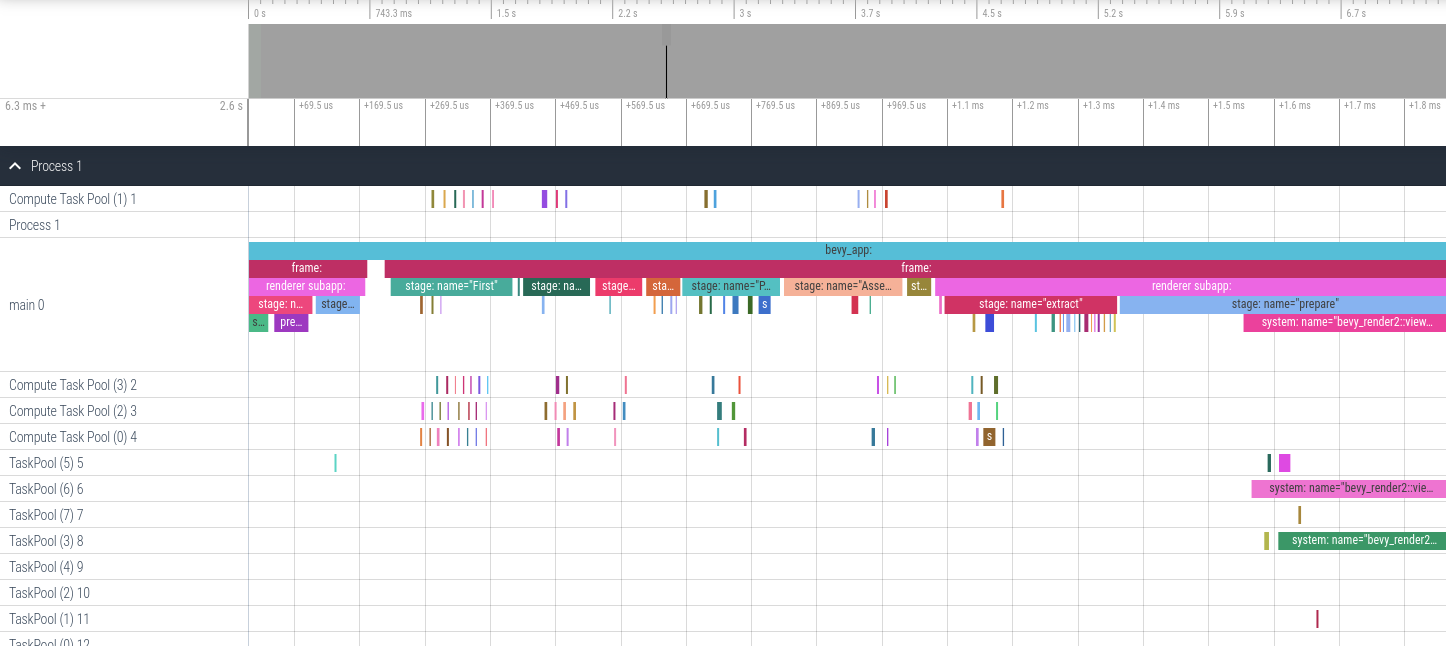
After running your app a json file in the "chrome tracing format" will be produced. You can open this file in your browser using https://ui.perfetto.dev. It will look something like this (make sure you expand Process 1):
Adding your own spans
Add spans to your app like this (these are in bevy::prelude::* and bevy::log::*, just like the normal logging macros).
let my_span = info_span!("span_name", name = "span_name");
{
  // starts the span's timer
  let guard = my_span.enter();
} // guard is dropped here ... this stops the timer
Search for info_span! in this repo for some real-world examples.
For more details, check out the tracing span docs.
perf Runtime Flame Graph
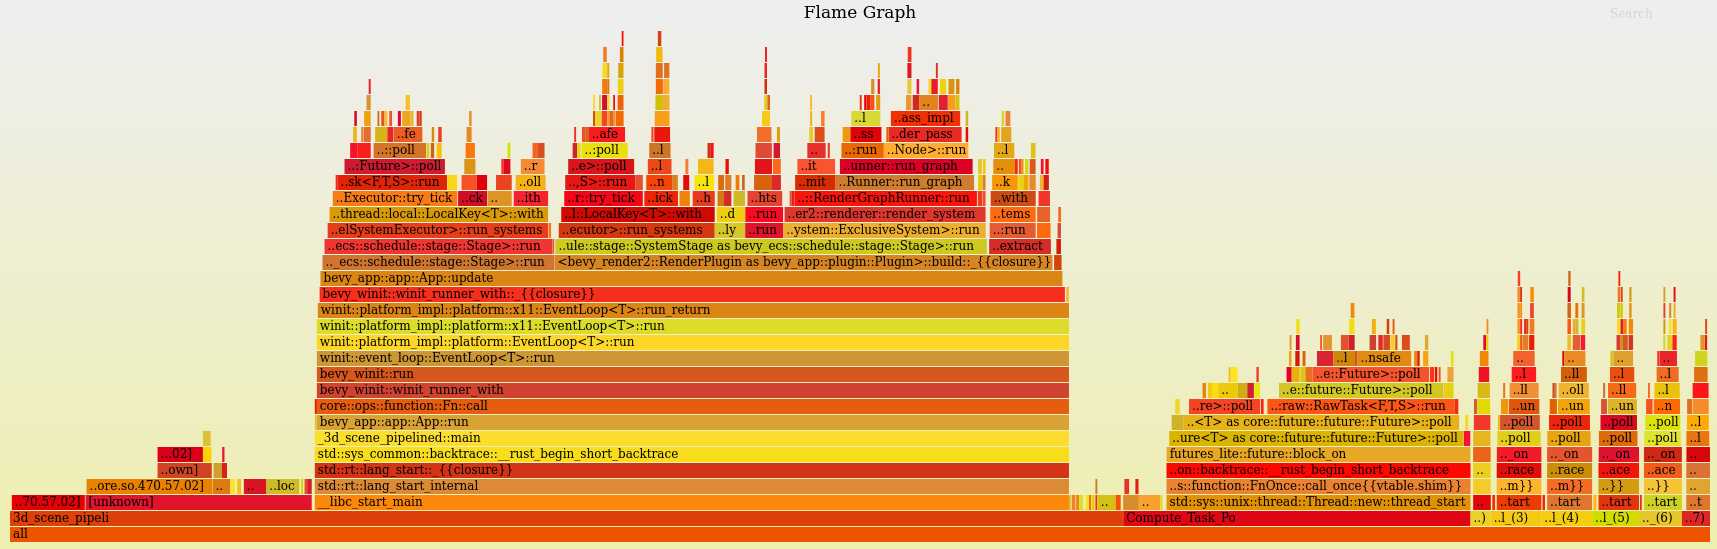
This approach requires no extra instrumentation and shows finer-grained flame graphs of actual code call trees. This is useful when you want to identify the specific function of a "hot spot". The downside is that it has higher overhead, so your app will run slower than it normally does.
Install cargo-flamegraph, enable debug symbols in your release build, then run your app using one of the following commands. Note that cargo-flamegraph forwards arguments to cargo. You should treat the cargo-flamegraph command as a replacement for cargo run --release. The commands below include --example EXAMPLE_NAME to illustrate, but you can remove those arguments in favor of whatever you use to run your app:
- Graph-Like Flame Graph:
RUSTFLAGS='-C force-frame-pointers=y' cargo flamegraph -c "record -g" --example EXAMPLE_NAME - Flat-ish Flame Graph:
RUSTFLAGS='-C force-frame-pointers=y' cargo flamegraph --example EXAMPLE_NAME
After closing your app, an interactive svg file will be produced:
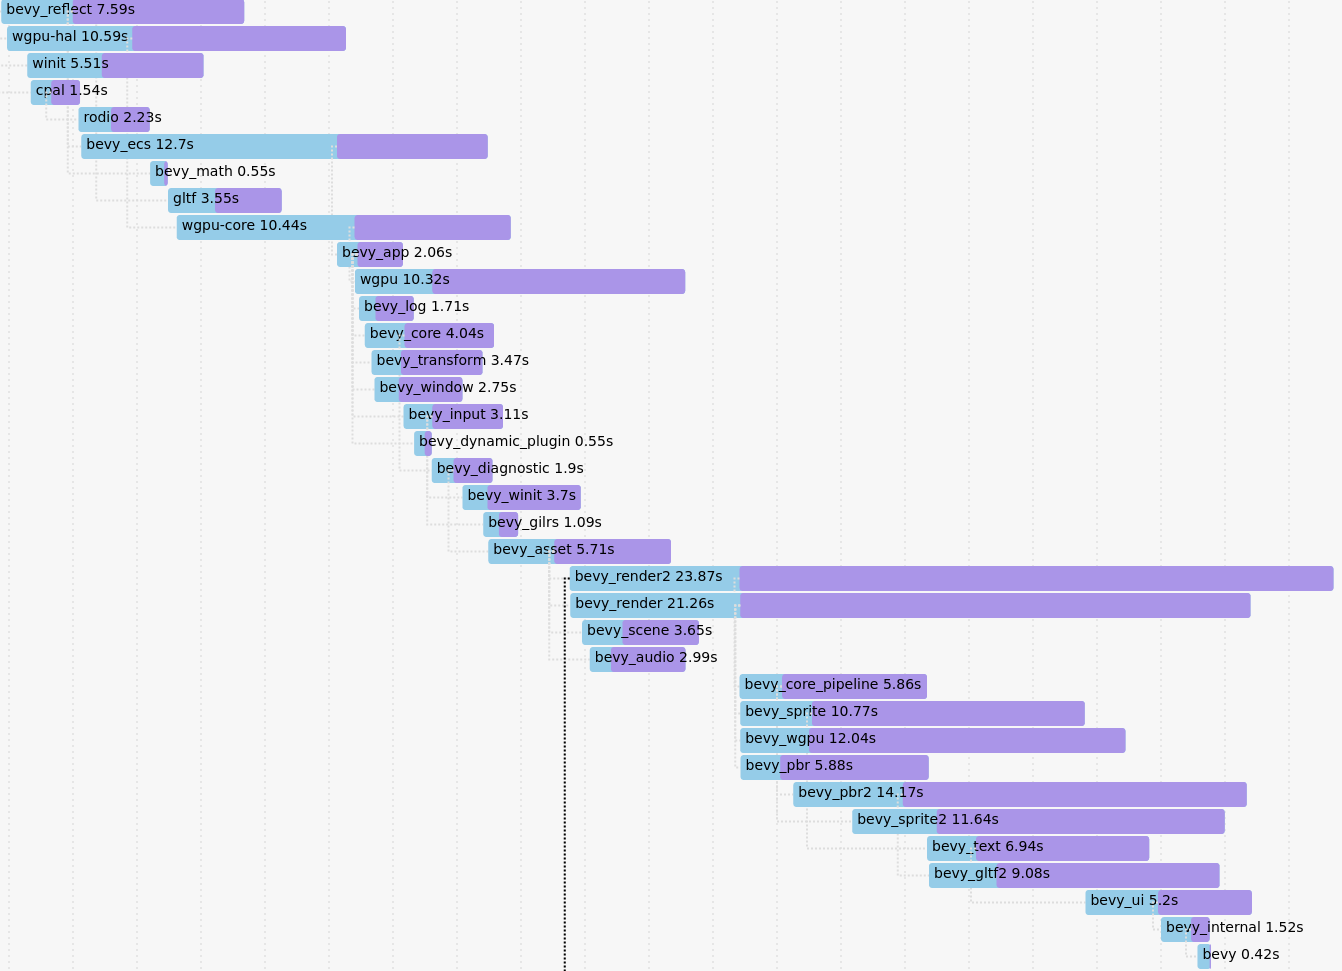
Project Compile Times
This requires nightly rust (rustup default nightly). Append -Ztimings to your app's cargo command (ex: cargo build -Ztimings). If you want a "full" profile, make sure you run cargo clean first. Open the produced cargo-timing.html file in your browser of choice. This will show how much time each crate in your app's dependency tree took to build.