* feat: Added initial dwarf debug counter example

* fix: update to readme and launch.json, task.json

* fix: fix tasks.json for debugging

* fix: added Trunk.toml to fix the port

* fix: moved example to projects
2.5 KiB
Debugging Leptos Counter Example in Browser and VSCode
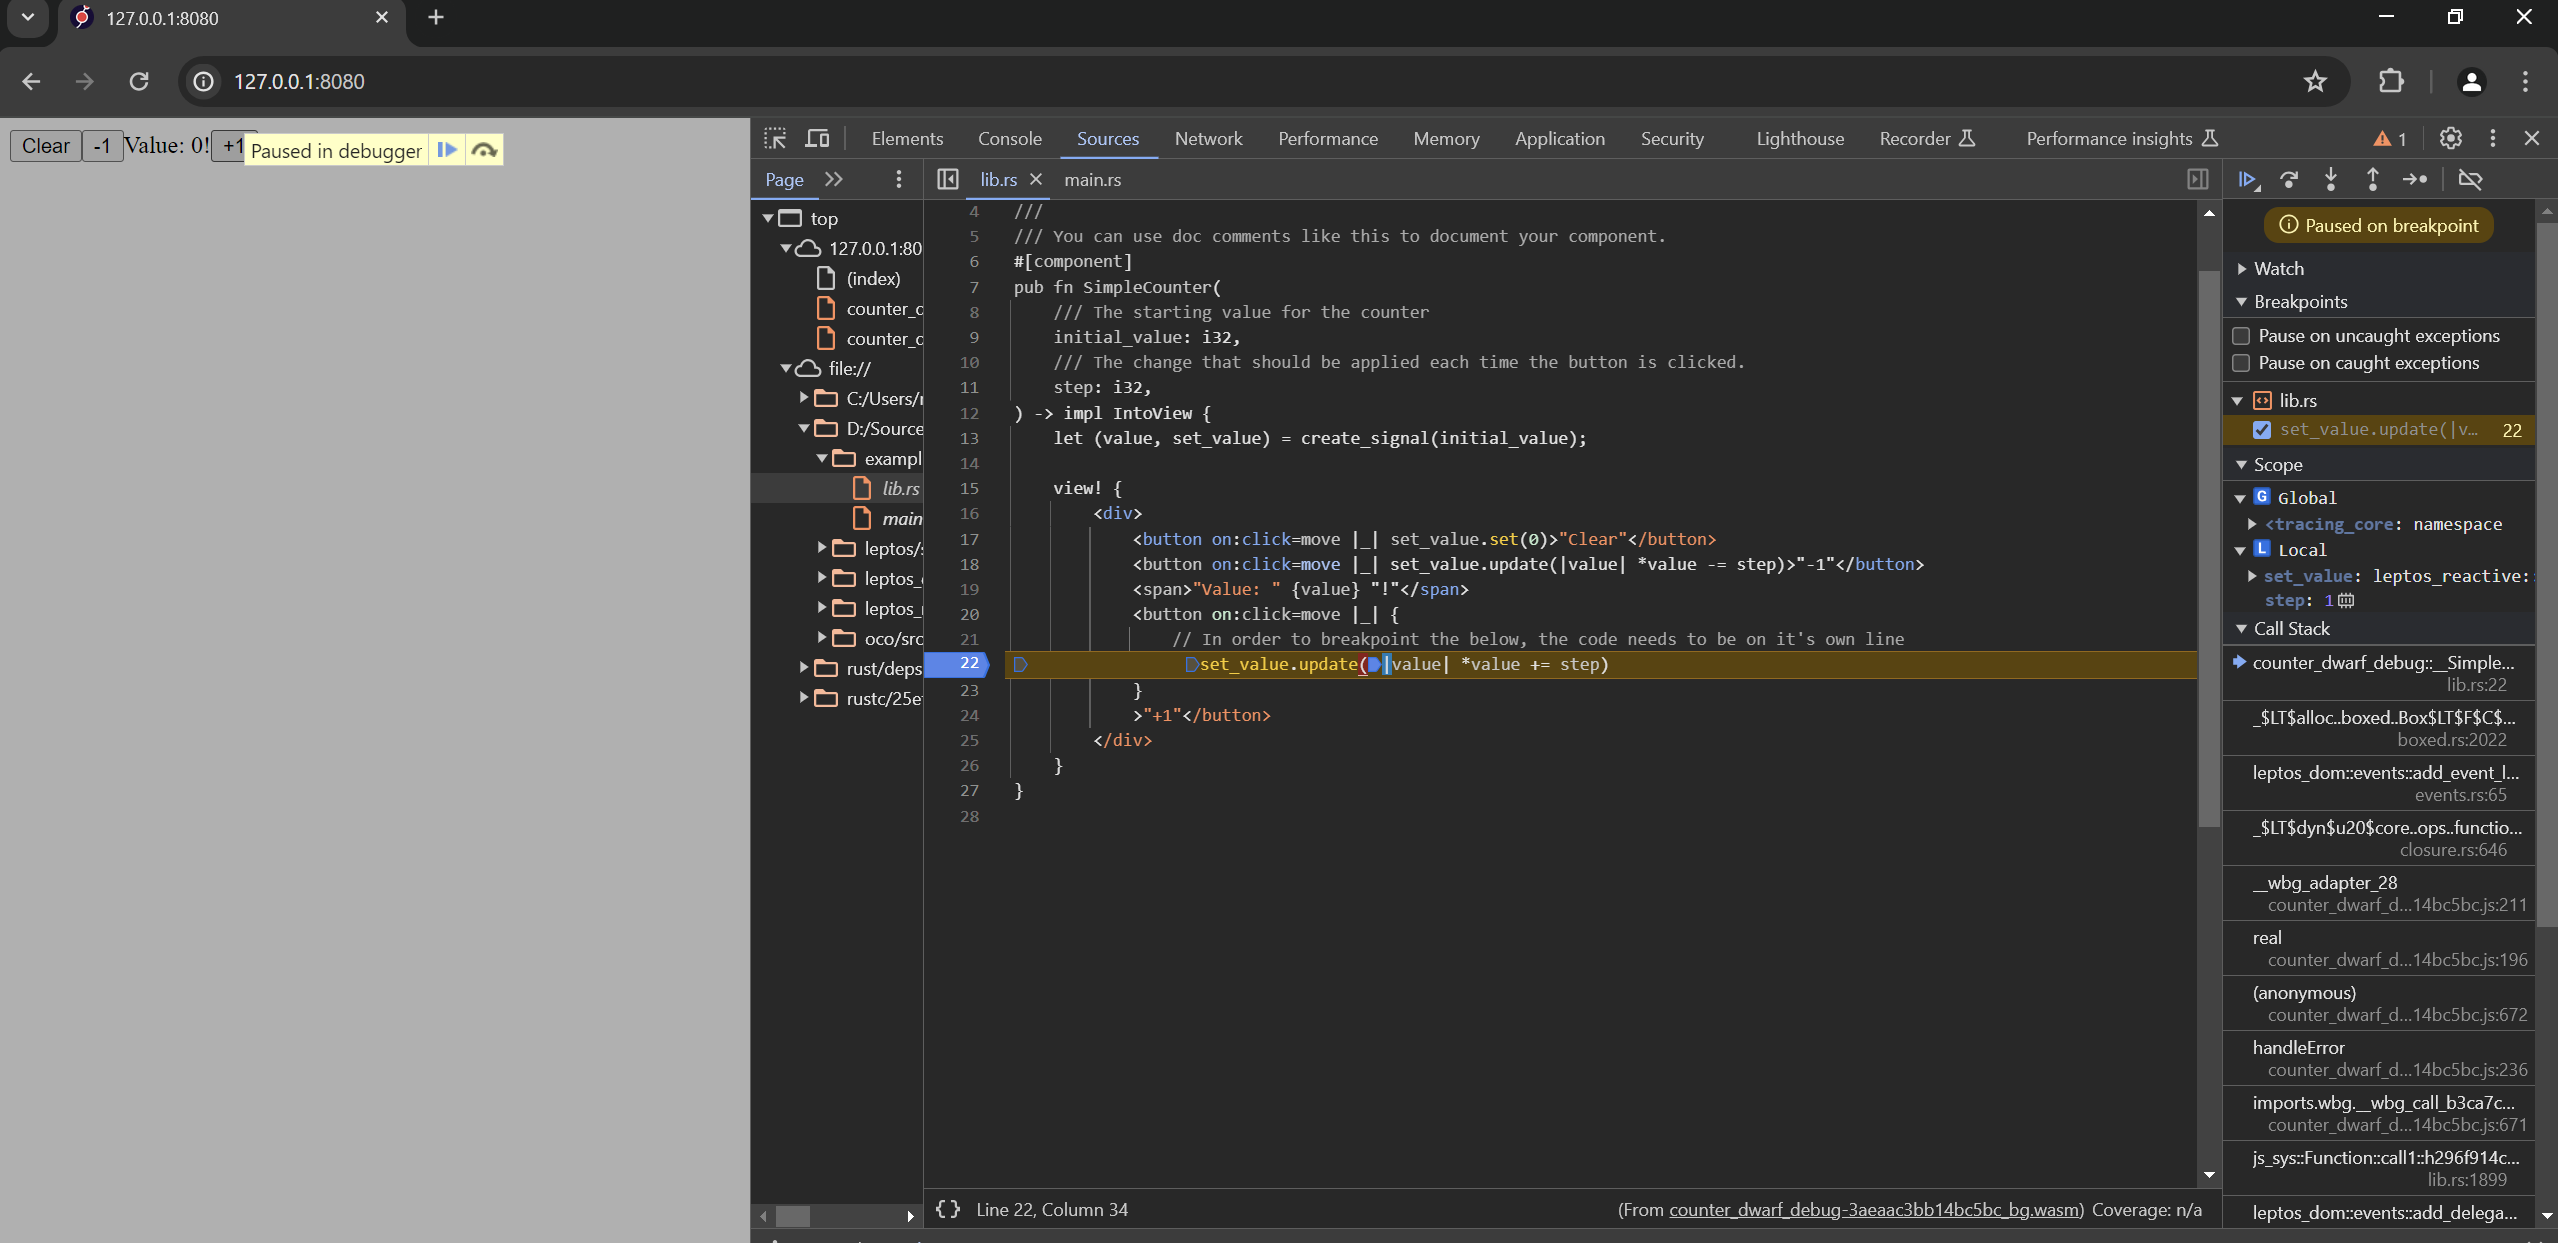
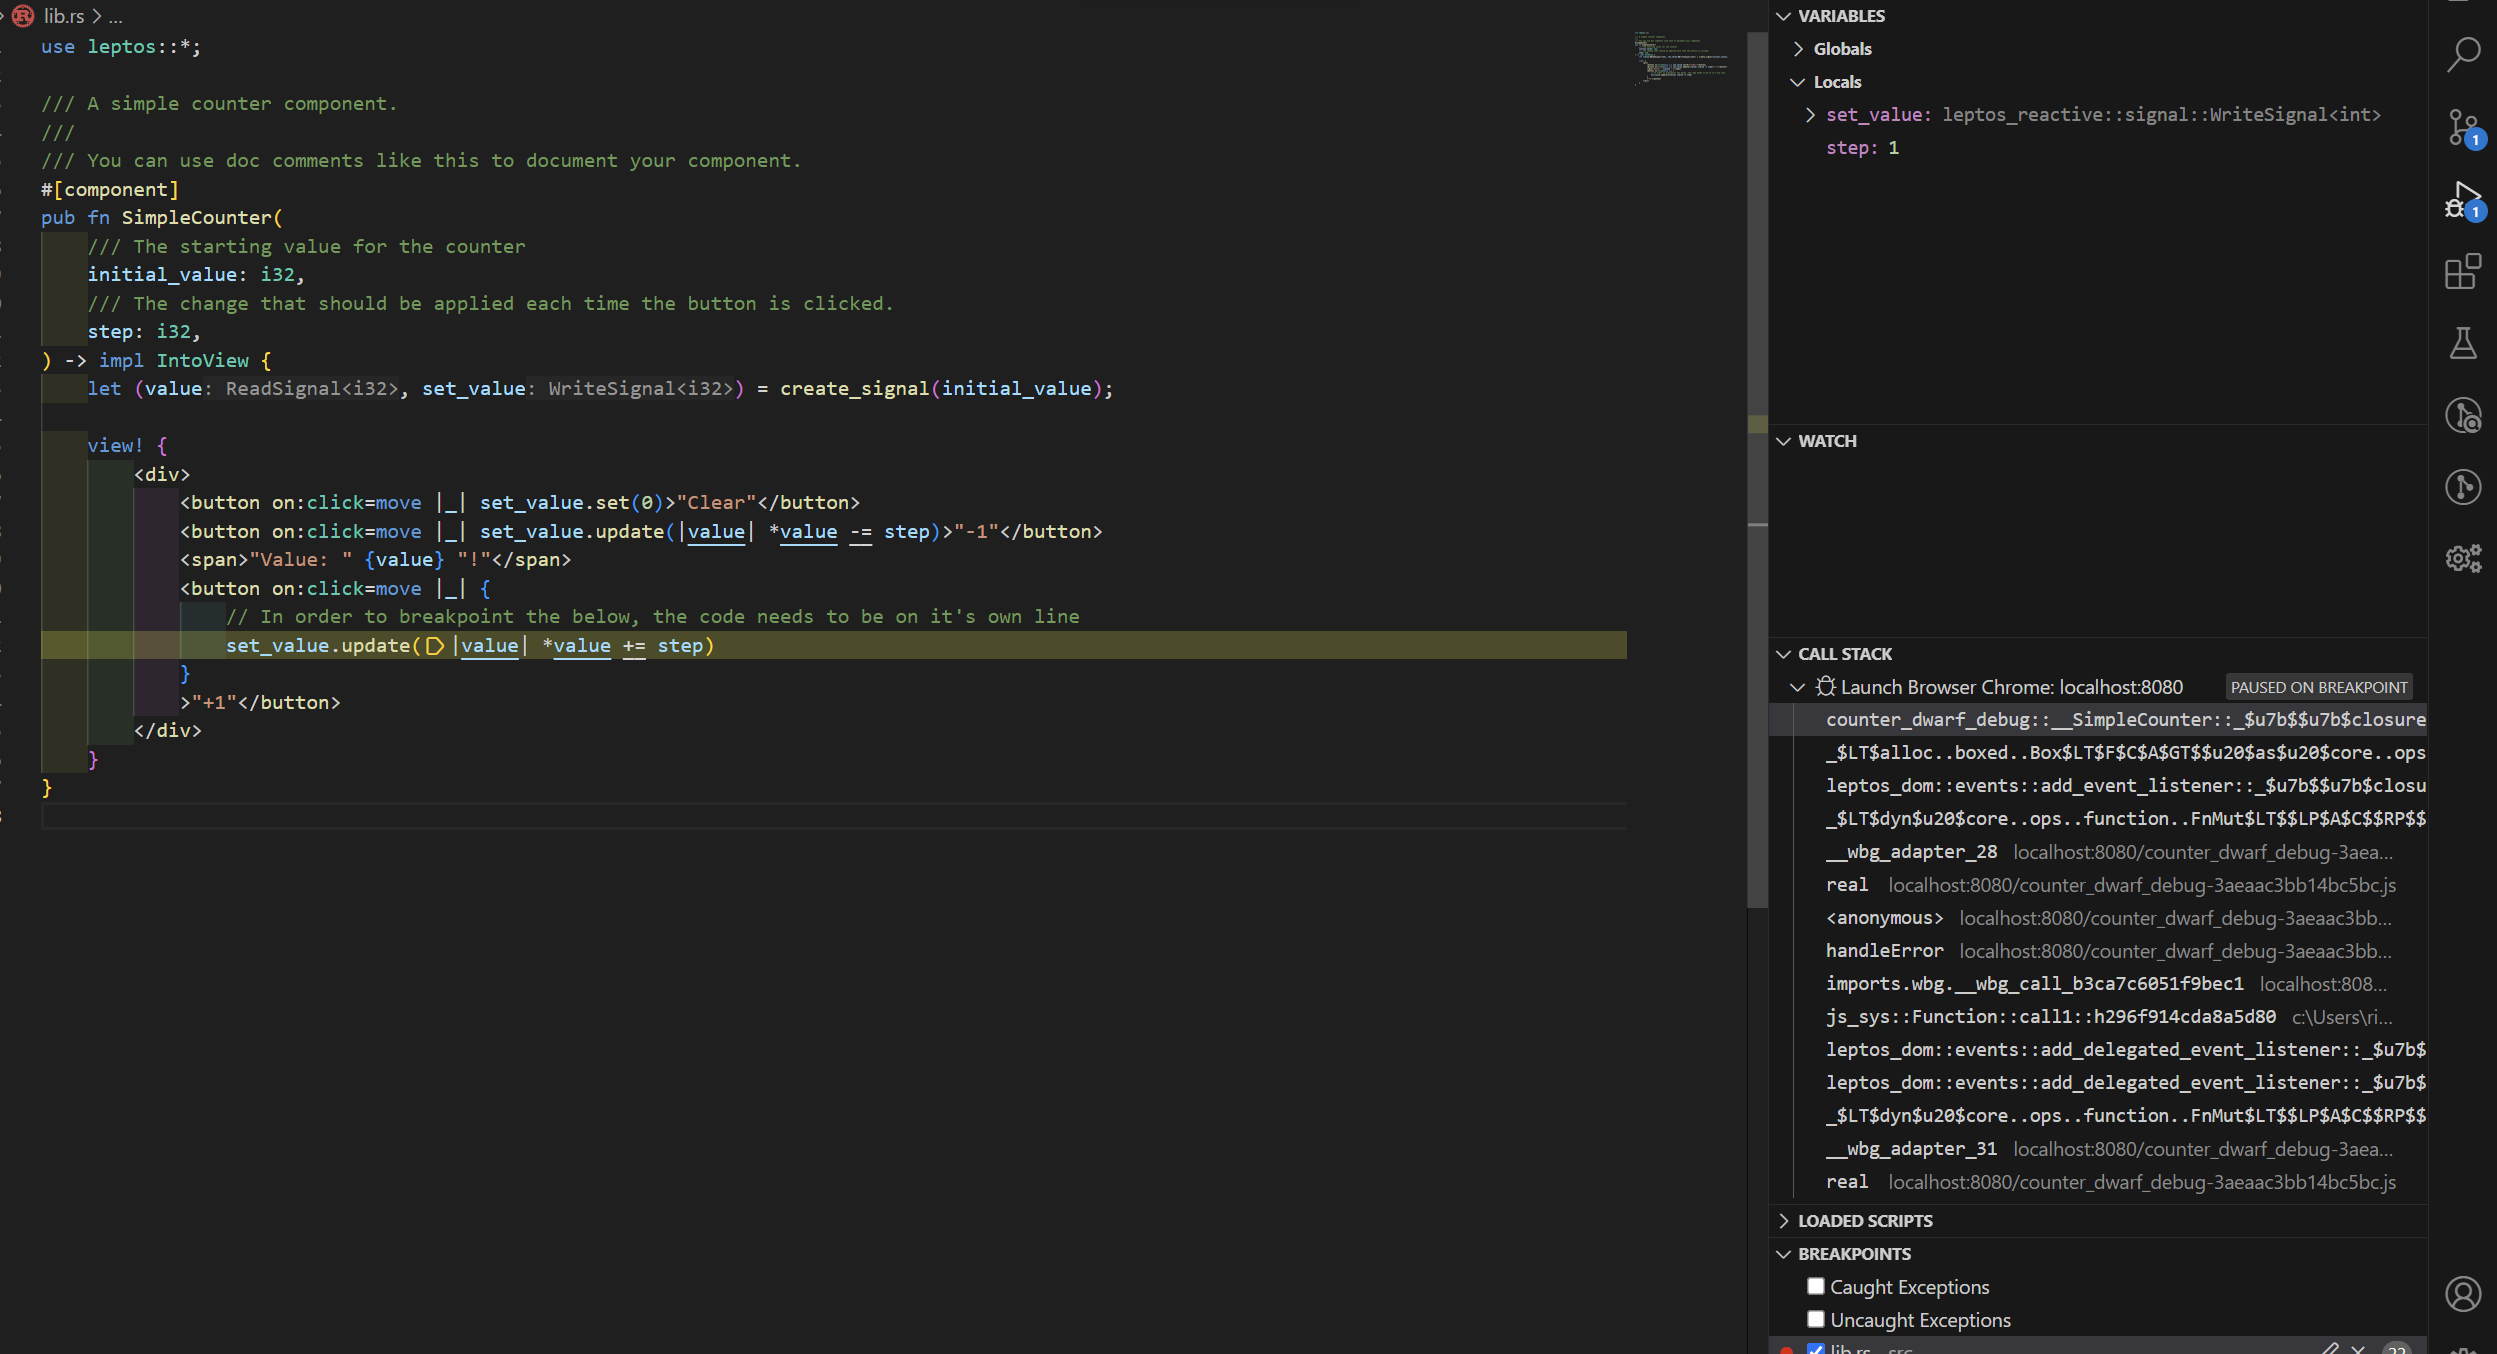
This example builds on the simple counter by adding breakpoints and single stepping the source code for debugging.
Both within the browser and VSCode.
This uses a new feature of wasm called Dwarf which is a form of source code mapping.
Note variable inspection during the breakpoints doesn't seem to work at this stage.
Quick Start
- Install the requirements below
- Open this directory within visual studio code
- Add a breakpoint to the code
- Launch the example using the visual studio code debug launcher
How This Works
Html Changes
First we need to make a change to the index.html file
From this
<link data-trunk rel="rust" data-wasm-opt="z"/>
To this
<link data-trunk rel="rust" data-keep-debug="true" data-wasm-opt="z"/>
This instructs the rust trunk utility to pass a long an option to wasm-bindgen called --keep-debug
This option bundles in a type of sourcemap into the built wasm file.
Be aware that this will make the wasm file much larger.
Browser Changes
Next we need to allow the browser to read the DWARF data from the wasm file. For Chrome / Opera there's an extension here that needs to be installed.
Debugging within the Browser
Within the browser's dev console it should now be possible to view the rust source code and add breakpoints.
Debugging within VSCode
Note this is still experimental, although I have managed to get breakpoints working under VSCode.
So far I've only tried this within a windows environment.
In order to have the breakpoints land at the correct position.
We need to install the following VSCode extension.
Within the browser launch section under launch.json we need to set userDataDir to false in order for the DWARF browser extension to be loaded.
  {
    "name": "Launch Browser Chrome",
    "request": "launch",
    "type": "chrome",
    "url": "http://localhost:8080",
    "webRoot": "${workspaceFolder}/dist",
    // Needed to keep the dwarf extension in the browser
    "userDataDir": false,
  },
Now we should be able to add breakpoints within visual studio code while debugging the rust wasm.

