19 KiB
Reversing Tools & Basic Methods
🎙️ HackTricks LIVE Twitch Wednesdays 5.30pm (UTC) 🎙️ - 🎥 Youtube 🎥
- Do you work in a cybersecurity company? Do you want to see your company advertised in HackTricks? or do you want to have access to the latest version of the PEASS or download HackTricks in PDF? Check the SUBSCRIPTION PLANS!
- Discover The PEASS Family, our collection of exclusive NFTs
- Get the official PEASS & HackTricks swag
- Join the 💬 Discord group or the telegram group or follow me on Twitter 🐦@carlospolopm.
- Share your hacking tricks by submitting PRs to the hacktricks repo and hacktricks-cloud repo.
Wasm decompiler / Wat compiler
Online:
- Use https://webassembly.github.io/wabt/demo/wasm2wat/index.html to decompile from wasm (binary) to wat (clear text)
- Use https://webassembly.github.io/wabt/demo/wat2wasm/ to compile from wat to wasm
- you can also try to use https://wwwg.github.io/web-wasmdec/ to decompile
Software:
.Net decompiler
https://github.com/icsharpcode/ILSpy
ILSpy plugin for Visual Studio Code: You can have it in any OS (you can install it directly from VSCode, no need to download the git. Click on Extensions and search ILSpy).
If you need to decompile, modify and recompile again you can use: https://github.com/0xd4d/dnSpy/releases (Right Click -> Modify Method to change something inside a function).
You cloud also try https://www.jetbrains.com/es-es/decompiler/
DNSpy Logging
In order to make DNSpy log some information in a file, you could use this .Net lines:
using System.IO;
path = "C:\\inetpub\\temp\\MyTest2.txt";
File.AppendAllText(path, "Password: " + password + "\n");
DNSpy Debugging
In order to debug code using DNSpy you need to:
First, change the Assembly attributes related to debugging:
From:
[assembly: Debuggable(DebuggableAttribute.DebuggingModes.IgnoreSymbolStoreSequencePoints)]
To:
[assembly: Debuggable(DebuggableAttribute.DebuggingModes.Default |
DebuggableAttribute.DebuggingModes.DisableOptimizations |
DebuggableAttribute.DebuggingModes.IgnoreSymbolStoreSequencePoints |
DebuggableAttribute.DebuggingModes.EnableEditAndContinue)]
And click on compile:
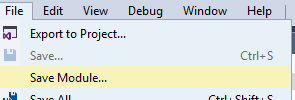
Then save the new file on File >> Save module...:
This is necessary because if you don't do this, at runtime several optimisations will be applied to the code and it could be possible that while debugging a break-point is never hit or some variables don't exist.
Then, if your .Net application is being run by IIS you can restart it with:
iisreset /noforce
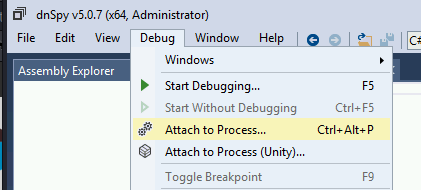
Then, in order to start debugging you should close all the opened files and inside the Debug Tab select Attach to Process...:
Then select w3wp.exe to attach to the IIS server and click attach:
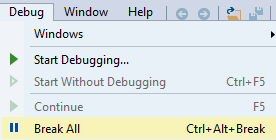
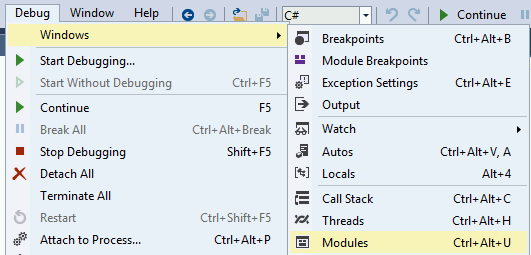
Now that we are debugging the process, it's time to stop it and load all the modules. First click on Debug >> Break All and then click on Debug >> Windows >> Modules:
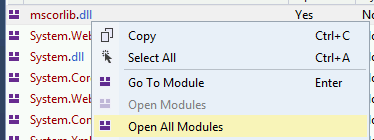
Click any module on Modules and select Open All Modules:
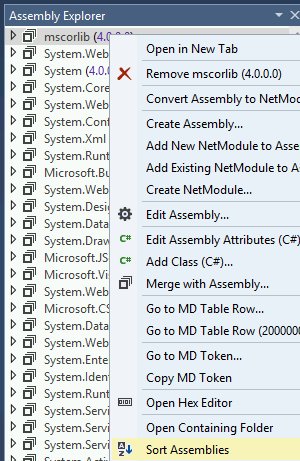
Right click any module in Assembly Explorer and click Sort Assemblies:
Java decompiler
https://github.com/skylot/jadx
https://github.com/java-decompiler/jd-gui/releases
Debugging DLLs
Using IDA
- Load rundll32 (64bits in C:\Windows\System32\rundll32.exe and 32 bits in C:\Windows\SysWOW64\rundll32.exe)
- Select Windbg debugger
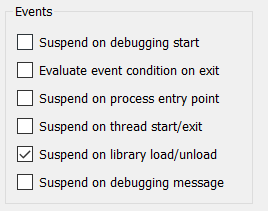
- Select "Suspend on library load/unload"
- Configure the parameters of the execution putting the path to the DLL and the function that you want to call:
Then, when you start debugging the execution will be stopped when each DLL is loaded, then, when rundll32 load your DLL the execution will be stopped.
But, how can you get to the code of the DLL that was lodaded? Using this method, I don't know how.
Using x64dbg/x32dbg
- Load rundll32 (64bits in C:\Windows\System32\rundll32.exe and 32 bits in C:\Windows\SysWOW64\rundll32.exe)
- Change the Command Line ( File --> Change Command Line ) and set the path of the dll and the function that you want to call, for example: "C:\Windows\SysWOW64\rundll32.exe" "Z:\shared\Cybercamp\rev2\\14.ridii_2.dll",DLLMain
- Change Options --> Settings and select "DLL Entry".
- Then start the execution, the debugger will stop at each dll main, at some point you will stop in the dll Entry of your dll. From there, just search for the points where you want to put a breakpoint.
Notice that when the execution is stopped by any reason in win64dbg you can see in which code you are looking in the top of the win64dbg window:
Then, looking to this ca see when the execution was stopped in the dll you want to debug.
GUI Apps / Videogames
Cheat Engine is a useful program to find where important values are saved inside the memory of a running game and change them. More info in:
{% content-ref url="cheat-engine.md" %} cheat-engine.md {% endcontent-ref %}
ARM & MIPS
{% embed url="https://github.com/nongiach/arm_now" %}
Shellcodes
Debugging a shellcode with blobrunner
Blobrunner will allocate the shellcode inside a space of memory, will indicate you the memory address were the shellcode was allocated and will stop the execution.
Then, you need to attach a debugger (Ida or x64dbg) to the process and put a breakpoint the indicated memory address and resume the execution. This way you will be debugging the shellcode.
The releases github page contains zips containing the compiled releases: https://github.com/OALabs/BlobRunner/releases/tag/v0.0.5
You can find a slightly modified version of Blobrunner in the following link. In order to compile it just create a C/C++ project in Visual Studio Code, copy and paste the code and build it.
{% content-ref url="blobrunner.md" %} blobrunner.md {% endcontent-ref %}
Debugging a shellcode with jmp2it
jmp2it is very similar to blobrunner. It will allocate the shellcode inside a space of memory, and start an eternal loop. You then need to attach the debugger to the process, play start wait 2-5 secs and press stop and you will find yourself inside the eternal loop. Jump to the next instruction of the eternal loop as it will be a call to the shellcode, and finally you will find yourself executing the shellcode.
You can download a compiled version of jmp2it inside the releases page.
Debugging shellcode using Cutter
Cutter is the GUI of radare. Using cutter you can emulate the shellcode and inspect it dynamically.
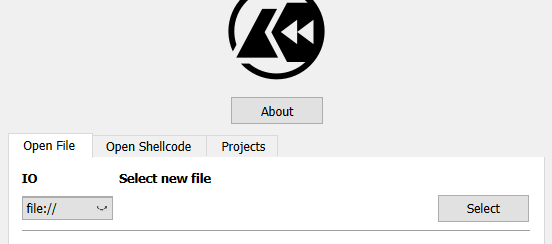
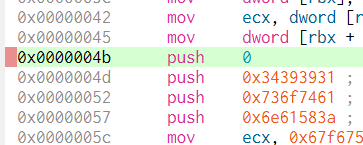
Note that Cutter allows you to "Open File" and "Open Shellcode". In my case when I opened the shellcode as a file it decompiled it correctly, but when I opened it as a shellcode it didn't:
In order to start the emulation in the place you want to, set a bp there and apparently cutter will automatically start the emulation from there:
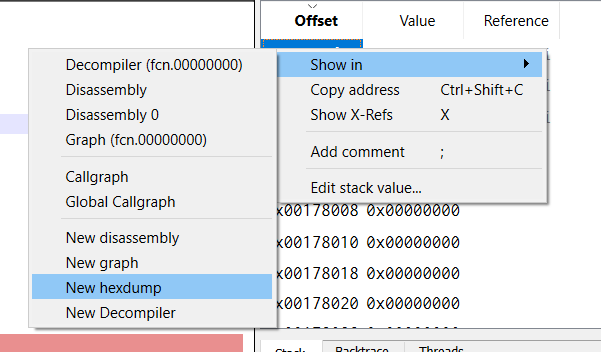
You can see the stack for example inside a hex dump:
Deobfuscating shellcode and getting executed functions
You should try scdbg.
It will tell you things like which functions is the shellcode using and if the shellcode is decoding itself in memory.
scdbg.exe -f shellcode # Get info
scdbg.exe -f shellcode -r #show analysis report at end of run
scdbg.exe -f shellcode -i -r #enable interactive hooks (file and network) and show analysis report at end of run
scdbg.exe -f shellcode -d #Dump decoded shellcode
scdbg.exe -f shellcode /findsc #Find offset where starts
scdbg.exe -f shellcode /foff 0x0000004D #Start the executing in that offset
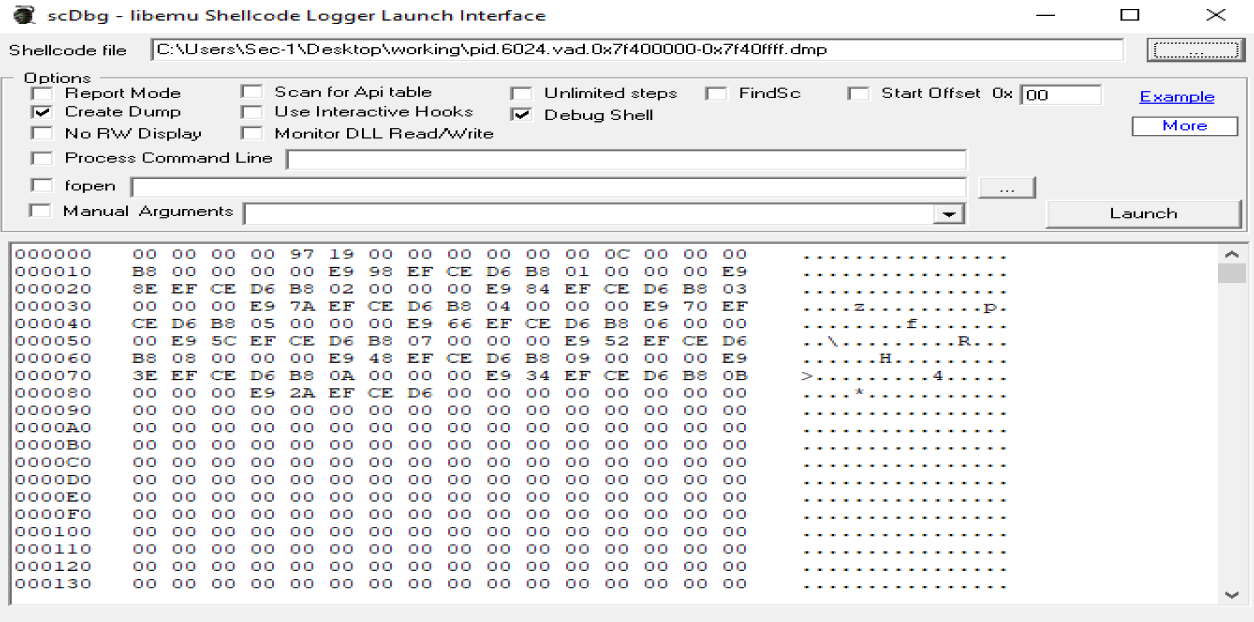
scDbg also counts with a graphical launcher where you can select the options you want and execute the shellcode
The Create Dump option will dump the final shellcode if any change is done to the shellcode dynamically in memory (useful to download the decoded shellcode). The start offset can be useful to start the shellcode at a specific offset. The Debug Shell option is useful to debug the shellcode using the scDbg terminal (however I find any of the options explained before better for this matter as you will be able to use Ida or x64dbg).
Disassembling using CyberChef
Upload you shellcode file as input and use the following receipt to decompile it: https://gchq.github.io/CyberChef/#recipe=To_Hex('Space',0)Disassemble_x86('32','Full%20x86%20architecture',16,0,true,true)
Movfuscator
This obfuscator modify all the instructions for mov(yeah, really cool). It also uses interruptions to change executions flows. For more information about how does it works:
- https://www.youtube.com/watch?v=2VF_wPkiBJY
- https://github.com/xoreaxeaxeax/movfuscator/blob/master/slides/domas_2015_the_movfuscator.pdf
If you are lucky demovfuscator will deofuscate the binary. It has several dependencies
apt-get install libcapstone-dev
apt-get install libz3-dev
And install keystone (apt-get install cmake; mkdir build; cd build; ../make-share.sh; make install)
If you are playing a CTF, this workaround to find the flag could be very useful: https://dustri.org/b/defeating-the-recons-movfuscator-crackme.html
Rust
To find the entry point search the functions by ::main like in:
In this case the binary was called authenticator, so it's pretty obvious that this is the interesting main function.
Having the name of the functions being called, search for them on the Internet to learn about their inputs and outputs.
Delphi
For Delphi compiled binaries you can use https://github.com/crypto2011/IDR
I you have to reverse a Delphi binary I would suggest you to use the IDA plugin https://github.com/Coldzer0/IDA-For-Delphi
Just press ATL+f7 (import python plugin in IDA) and select the python plugin.
This plugin will execute the binary and resolve function names dynamically at the start of the debugging. After starting the debugging press again the Start button (the green one or f9) and a breakpoint will hit in the beginning of the real code.
It is also very interesting because if you press a button in the graphic application the debugger will stop in the function executed by that bottom.
Golang
I you have to reverse a Golang binary I would suggest you to use the IDA plugin https://github.com/sibears/IDAGolangHelper
Just press ATL+f7 (import python plugin in IDA) and select the python plugin.
This will resolve the names of the functions.
Compiled Python
In this page you can find how to get the python code from an ELF/EXE python compiled binary:
{% content-ref url="../../forensics/basic-forensic-methodology/specific-software-file-type-tricks/.pyc.md" %} .pyc.md {% endcontent-ref %}
GBA - Game Body Advance
If you get the binary of a GBA game you can use different tools to emulate and debug it:
- no$gba (Download the debug version) - Contains a debugger with interface
- mgba - Contains a CLI debugger
- gba-ghidra-loader - Ghidra plugin
- GhidraGBA - Ghidra plugin
In no$gba, in Options --> Emulation Setup --> Controls** ** you can see how to press the Game Boy Advance buttons
When pressed, each key has a value to identify it:
A = 1
B = 2
SELECT = 4
START = 8
RIGHT = 16
LEFT = 32
UP = 64
DOWN = 128
R = 256
L = 256
So, in this kind of programs, the an interesting part will be how the program treats the user input. In the address 0x4000130 you will find the commonly found function: KEYINPUT.
In the previous image you can find that the function is called from FUN_080015a8 (addresses: 0x080015fa and 0x080017ac).
In that function, after some init operations (without any importance):
void FUN_080015a8(void)

{
  ushort uVar1;
  undefined4 uVar2;
  undefined4 uVar3;
  ushort uVar4;
  int iVar5;
  ushort *puVar6;
  undefined *local_2c;

  DISPCNT = 0x1140;
  FUN_08000a74();
  FUN_08000ce4(1);
  DISPCNT = 0x404;
  FUN_08000dd0(&DAT_02009584,0x6000000,&DAT_030000dc);
  FUN_08000354(&DAT_030000dc,0x3c);
  uVar4 = DAT_030004d8;
It's found this code:
  do {
    DAT_030004da = uVar4; //This is the last key pressed
    DAT_030004d8 = KEYINPUT | 0xfc00;
    puVar6 = &DAT_0200b03c;
    uVar4 = DAT_030004d8;
    do {
      uVar2 = DAT_030004dc;
      uVar1 = *puVar6;
      if ((uVar1 & DAT_030004da & ~uVar4) != 0) {
The last if is checking uVar4 is in the last Keys and not is the current key, also called letting go off a button (current key is stored in uVar1).
        if (uVar1 == 4) {
          DAT_030000d4 = 0;
          uVar3 = FUN_08001c24(DAT_030004dc);
          FUN_08001868(uVar2,0,uVar3);
          DAT_05000000 = 0x1483;
          FUN_08001844(&DAT_0200ba18);
          FUN_08001844(&DAT_0200ba20,&DAT_0200ba40);
          DAT_030000d8 = 0;
          uVar4 = DAT_030004d8;
        }
        else {
          if (uVar1 == 8) {
            if (DAT_030000d8 == 0xf3) {
              DISPCNT = 0x404;
              FUN_08000dd0(&DAT_02008aac,0x6000000,&DAT_030000dc);
              FUN_08000354(&DAT_030000dc,0x3c);
              uVar4 = DAT_030004d8;
            }
          }
          else {
            if (DAT_030000d4 < 8) {
              DAT_030000d4 = DAT_030000d4 + 1;
              FUN_08000864();
              if (uVar1 == 0x10) {
                DAT_030000d8 = DAT_030000d8 + 0x3a;
In the previous code you can see that we are comparing uVar1 (the place where the value of the pressed button is) with some values:
- First, it's compared with the value 4 (SELECT button): In the challenge this button clears the screen
- Then, it's comparing it with the value 8 (START button): In the challenge this checks is the code is valid to get the flag.
- In this case the var
DAT_030000d8is compared with 0xf3 and if the value is the same some code is executed.
- In this case the var
- In any other cases, some cont (
DAT_030000d4) is checked. It's a cont because it's adding 1 right after entering in the code.
If less than 8 something that involves adding values to **DAT_030000d8** is done (basically it's adding the values of the keys pressed in this variable as long as the cont is less than 8).
So, in this challenge, knowing the values of the buttons, you needed to press a combination with a length smaller than 8 that the resulting addition is 0xf3.
Reference for this tutorial: https://exp.codes/Nostalgia/
Game Boy
{% embed url="https://www.youtube.com/watch?v=VVbRe7wr3G4" %}
Courses
- https://github.com/0xZ0F/Z0FCourse_ReverseEngineering
- https://github.com/malrev/ABD (Binary deobfuscation)
🎙️ HackTricks LIVE Twitch Wednesdays 5.30pm (UTC) 🎙️ - 🎥 Youtube 🎥
- Do you work in a cybersecurity company? Do you want to see your company advertised in HackTricks? or do you want to have access to the latest version of the PEASS or download HackTricks in PDF? Check the SUBSCRIPTION PLANS!
- Discover The PEASS Family, our collection of exclusive NFTs
- Get the official PEASS & HackTricks swag
- Join the 💬 Discord group or the telegram group or follow me on Twitter 🐦@carlospolopm.
- Share your hacking tricks by submitting PRs to the hacktricks repo and hacktricks-cloud repo.


