34 KiB
macOS Apps - Inspecting, debugging and Fuzzing
{% hint style="success" %}
Learn & practice AWS Hacking: HackTricks Training AWS Red Team Expert (ARTE)
Learn & practice GCP Hacking:  HackTricks Training GCP Red Team Expert (GRTE)
Support HackTricks
- Check the subscription plans!
- Join the 💬 Discord group or the telegram group or follow us on Twitter 🐦 @hacktricks_live.
- Share hacking tricks by submitting PRs to the HackTricks and HackTricks Cloud github repos.
Static Analysis
otool & objdump & nm
otool -L /bin/ls #List dynamically linked libraries
otool -tv /bin/ps #Decompile application
{% code overflow="wrap" %}
objdump -m --dylibs-used /bin/ls #List dynamically linked libraries
objdump -m -h /bin/ls # Get headers information
objdump -m --syms /bin/ls # Check if the symbol table exists to get function names
objdump -m --full-contents /bin/ls # Dump every section
objdump -d /bin/ls # Dissasemble the binary
objdump --disassemble-symbols=_hello --x86-asm-syntax=intel toolsdemo #Disassemble a function using intel flavour
{% endcode %}
nm -m ./tccd # List of symbols
jtool2 & Disarm
You can download disarm from here.
ARCH=arm64e disarm -c -i -I --signature /path/bin # Get bin info and signature
ARCH=arm64e disarm -c -l /path/bin # Get binary sections
ARCH=arm64e disarm -c -L /path/bin # Get binary commands (dependencies included)
ARCH=arm64e disarm -c -S /path/bin # Get symbols (func names, strings...)
ARCH=arm64e disarm -c -d /path/bin # Get disasembled
jtool2 -d __DATA.__const myipc_server | grep MIG # Get MIG info
You can download jtool2 here or install it with brew.
# Install
brew install --cask jtool2

jtool2 -l /bin/ls # Get commands (headers)
jtool2 -L /bin/ls # Get libraries
jtool2 -S /bin/ls # Get symbol info
jtool2 -d /bin/ls # Dump binary
jtool2 -D /bin/ls # Decompile binary

# Get signature information
ARCH=x86_64 jtool2 --sig /System/Applications/Automator.app/Contents/MacOS/Automator

# Get MIG information
jtool2 -d __DATA.__const myipc_server | grep MIG
{% hint style="danger" %} jtool is deprecated in favour of disarm {% endhint %}
Codesign / ldid
{% hint style="success" %}
Codesign can be found in macOS while ldid can be found in iOS
{% endhint %}
# Get signer
codesign -vv -d /bin/ls 2>&1 | grep -E "Authority|TeamIdentifier"

# Check if the app’s contents have been modified
codesign --verify --verbose /Applications/Safari.app

# Get entitlements from the binary
codesign -d --entitlements :- /System/Applications/Automator.app # Check the TCC perms

# Check if the signature is valid
spctl --assess --verbose /Applications/Safari.app

# Sign a binary
codesign -s <cert-name-keychain> toolsdemo

# Get signature info
ldid -h <binary>

# Get entitlements
ldid -e <binary>

# Change entilements
## /tmp/entl.xml is a XML file with the new entitlements to add
ldid -S/tmp/entl.xml <binary>
SuspiciousPackage
SuspiciousPackage is a tool useful to inspect .pkg files (installers) and see what is inside before installing it.
These installers have preinstall and postinstall bash scripts that malware authors usually abuse to persist the malware.
hdiutil
This tool allows to mount Apple disk images (.dmg) files to inspect them before running anything:
hdiutil attach ~/Downloads/Firefox\ 58.0.2.dmg
It will be mounted in /Volumes
Packed binaries
- Check for high entropy
- Check the strings (is there is almost no understandable string, packed)
- The UPX packer for MacOS generates a section called "__XHDR"
Static Objective-C analysis
Metadata
{% hint style="danger" %} Note that programs written in Objective-C retain their class declarations when compiled into Mach-O binaries. Such class declarations include the name and type of: {% endhint %}
- The interfaces defined
- The interface methods
- The interface instance variables
- The protocols defined
Note that this names could be obfuscated to make the reversing of the binary more difficult.
Function calling
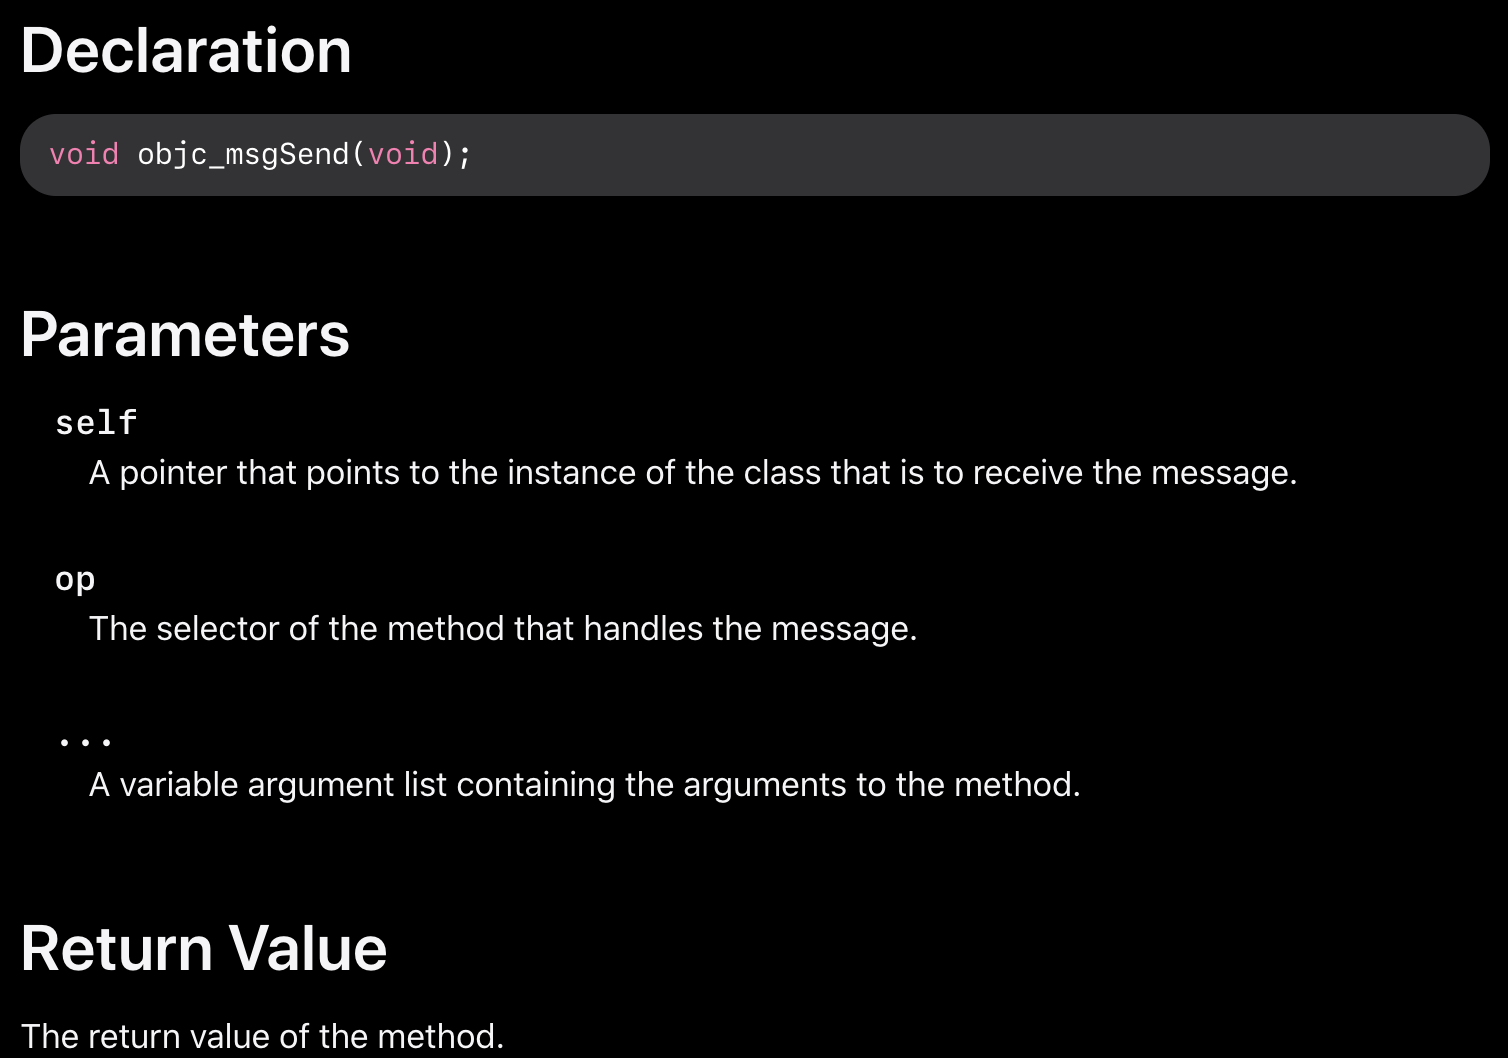
When a function is called in a binary that uses objective-C, the compiled code instead of calling that function, it will call objc_msgSend. Which will be calling the final function:
The params this function expects are:
- The first parameter (self) is "a pointer that points to the instance of the class that is to receive the message". Or more simply put, it’s the object that the method is being invoked upon. If the method is a class method, this will be an instance of the class object (as a whole), whereas for an instance method, self will point to an instantiated instance of the class as an object.
- The second parameter, (op), is "the selector of the method that handles the message". Again, more simply put, this is just the name of the method.
- The remaining parameters are any values that are required by the method (op).
See how to get this info easily with lldb in ARM64 in this page:
{% content-ref url="arm64-basic-assembly.md" %} arm64-basic-assembly.md {% endcontent-ref %}
x64:
| Argument | Register | (for) objc_msgSend |
|---|---|---|
| 1st argument | rdi | self: object that the method is being invoked upon |
| 2nd argument | rsi | op: name of the method |
| 3rd argument | rdx | 1st argument to the method |
| 4th argument | rcx | 2nd argument to the method |
| 5th argument | r8 | 3rd argument to the method |
| 6th argument | r9 | 4th argument to the method |
| 7th+ argument | rsp+ |
5th+ argument to the method |
Dump ObjectiveC metadata
Dynadump
Dynadump is a tool to class-dump Objective-C binaries. The github specifies dylibs but this also works with executables.
./dynadump dump /path/to/bin
At the time of the writing, this is currently the one that works the best.
Regular tools
nm --dyldinfo-only /path/to/bin
otool -ov /path/to/bin
objdump --macho --objc-meta-data /path/to/bin
class-dump
class-dump is the original tool to generates declarations for the classes, categories and protocols in ObjetiveC formatted code.
It's old and unmaintained so it probably won't work properly.
ICDump
iCDump is a modern and cross-platform Objective-C class dump. Compared to existing tools, iCDump can run independently from the Apple ecosystem and it exposes Python bindings.
import icdump
metadata = icdump.objc.parse("/path/to/bin")

print(metadata.to_decl())
Static Swift analysis
With Swift binaries, since there is Objective-C compatibility, sometimes you can extract declarations using class-dump but not always.
With the jtool -l or otool -l command lines it's possible ti find several sections that start with __swift5 prefix:
jtool2 -l /Applications/Stocks.app/Contents/MacOS/Stocks
LC 00: LC_SEGMENT_64              Mem: 0x000000000-0x100000000    __PAGEZERO
LC 01: LC_SEGMENT_64              Mem: 0x100000000-0x100028000    __TEXT
    [...]
    Mem: 0x100026630-0x100026d54        __TEXT.__swift5_typeref
    Mem: 0x100026d60-0x100027061        __TEXT.__swift5_reflstr
    Mem: 0x100027064-0x1000274cc        __TEXT.__swift5_fieldmd
    Mem: 0x1000274cc-0x100027608        __TEXT.__swift5_capture
    [...]
You can find further information about the information stored in these section in this blog post.
Moreover, Swift binaries might have symbols (for example libraries need to store symbols so its functions can be called). The symbols usually have the info about the function name and attr in a ugly way, so they are very useful and there are "demanglers" that can get the original name:
# Ghidra plugin
https://github.com/ghidraninja/ghidra_scripts/blob/master/swift_demangler.py

# Swift cli
swift demangle
Dynamic Analysis
{% hint style="warning" %}
Note that in order to debug binaries, SIP needs to be disabled (csrutil disable or csrutil enable --without debug) or to copy the binaries to a temporary folder and remove the signature with codesign --remove-signature <binary-path> or allow the debugging of the binary (you can use this script)
{% endhint %}
{% hint style="warning" %}
Note that in order to instrument system binaries, (such as cloudconfigurationd) on macOS, SIP must be disabled (just removing the signature won't work).
{% endhint %}
APIs
macOS exposes some interesting APIs that give information about the processes:
proc_info: This is the main one giving a lot of information about each process. You need to be root to get other processes information but you don't need special entitlements or mach ports.libsysmon.dylib: It allows to get information about processes via XPC exposed functions, however, it's needed to have the entitlementcom.apple.sysmond.client.
Stackshot & microstackshots
Stackshotting is a technique used to capture the state of the processes, including the call stacks of all running threads. This is particularly useful for debugging, performance analysis, and understanding the behavior of the system at a specific point in time. On iOS and macOS, stackshotting can be performed using several tools and methods like the tools sample and spindump.
Sysdiagnose
This tool (/usr/bini/ysdiagnose) basically collects a lot of information from your computer executing tens of different commands such as ps, zprint...
It must be run as root and the daemon /usr/libexec/sysdiagnosed has very interesting entitlements such as com.apple.system-task-ports and get-task-allow.
Its plist is located in /System/Library/LaunchDaemons/com.apple.sysdiagnose.plist which declares 3 MachServices:
com.apple.sysdiagnose.CacheDelete: Deletes old archives in /var/rmpcom.apple.sysdiagnose.kernel.ipc: Special port 23 (kernel)com.apple.sysdiagnose.service.xpc: User mode interface throughLibsysdiagnoseObj-C class. Three arguments in a dict can be passed (compress,display,run)
Unified Logs
MacOS generates a lot of logs that can be very useful when running an application trying to understand what is it doing.
Moreover, the are some logs that will contain the tag <private> to hide some user or computer identifiable information. However, it's possible to install a certificate to disclose this information. Follow the explanations from here.
Hopper
Left panel
In the left panel of hopper it's possible to see the symbols (Labels) of the binary, the list of procedures and functions (Proc) and the strings (Str). Those aren't all the strings but the ones defined in several parts of the Mac-O file (like cstring or objc_methname).
Middle panel
In the middle panel you can see the dissasembled code. And you can see it a raw disassemble, as graph, as decompiled and as binary by clicking on the respective icon:

Right clicking in a code object you can see references to/from that object or even change its name (this doesn't work in decompiled pseudocode):
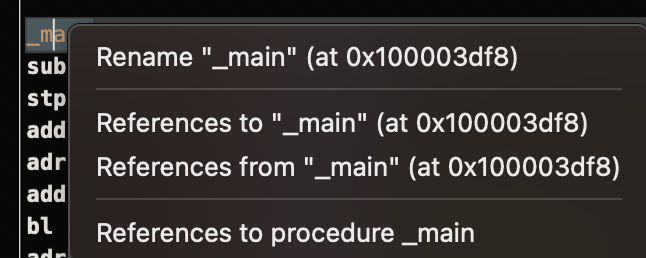
Moreover, in the middle down you can write python commands.
Right panel
In the right panel you can see interesting information such as the navigation history (so you know how you arrived at the current situation), the call graph where you can see all the functions that call this function and all the functions that this function calls, and local variables information.
dtrace
It allows users access to applications at an extremely low level and provides a way for users to trace programs and even change their execution flow. Dtrace uses probes which are placed throughout the kernel and are at locations such as the beginning and end of system calls.
DTrace uses the dtrace_probe_create function to create a probe for each system call. These probes can be fired in the entry and exit point of each system call. The interaction with DTrace occur through /dev/dtrace which is only available for the root user.
{% hint style="success" %}
To enable Dtrace without fully disabling SIP protection you could execute on recovery mode: csrutil enable --without dtrace
You can also dtrace or dtruss binaries that you have compiled.
{% endhint %}
The available probes of dtrace can be obtained with:
dtrace -l | head
   ID   PROVIDER            MODULE                          FUNCTION NAME
    1     dtrace                                                     BEGIN
    2     dtrace                                                     END
    3     dtrace                                                     ERROR
   43    profile                                                     profile-97
   44    profile                                                     profile-199
The probe name consists of four parts: the provider, module, function, and name (fbt:mach_kernel:ptrace:entry). If you not specifies some part of the name, Dtrace will apply that part as a wildcard.
To configure DTrace to activate probes and to specify what actions to perform when they fire, we will need to use the D language.
A more detailed explanation and more examples can be found in https://illumos.org/books/dtrace/chp-intro.html
Examples
Run man -k dtrace to list the DTrace scripts available. Example: sudo dtruss -n binary
- In line
#Count the number of syscalls of each running process
sudo dtrace -n 'syscall:::entry {@[execname] = count()}'
- script
syscall:::entry
/pid == $1/
{
}

#Log every syscall of a PID
sudo dtrace -s script.d 1234
syscall::open:entry
{
    printf("%s(%s)", probefunc, copyinstr(arg0));
}
syscall::close:entry
{
        printf("%s(%d)\n", probefunc, arg0);
}

#Log files opened and closed by a process
sudo dtrace -s b.d -c "cat /etc/hosts"
syscall:::entry
{
        ;
}
syscall:::return
{
        printf("=%d\n", arg1);
}

#Log sys calls with values
sudo dtrace -s syscalls_info.d -c "cat /etc/hosts"
dtruss
dtruss -c ls #Get syscalls of ls
dtruss -c -p 1000 #get syscalls of PID 1000
kdebug
It's a kernel tracing facility. The documented codes can be found in /usr/share/misc/trace.codes.
Tools like latency, sc_usage, fs_usage and trace use it internally.
To interface with kdebug sysctl is used over the kern.kdebug namespace and the MIBs to use can be found in sys/sysctl.h having the functions implemented in bsd/kern/kdebug.c.
To interact with kdebug with a custom client these are usually the steps:
- Remove existing settings with KERN_KDSETREMOVE
- Set trace with KERN_KDSETBUF and KERN_KDSETUP
- Use KERN_KDGETBUF to get number of buffer entries
- Get the own client out of the trace with KERN_KDPINDEX
- Enable tracing with KERN_KDENABLE
- Read the buffer calling KERN_KDREADTR
- To match each thread with its process call KERN_KDTHRMAP.
In order to get this information it's possible to use the Apple tool trace or the custom tool kDebugView (kdv).
Note that Kdebug is only available for 1 costumer at a time. So only one k-debug powered tool can be executed at the same time.
ktrace
The ktrace_* APIs come from libktrace.dylib which wrap those of Kdebug. Then, a client can just call ktrace_session_create and ktrace_events_[single/class] to set callbacks on specific codes and then start it with ktrace_start.
You can use this one even with SIP activated
You can use as clients the utility ktrace:
ktrace trace -s -S -t c -c ls | grep "ls("
Or tailspin.
kperf
This is used to do a kernel level profiling and it's built using Kdebug callouts.
Basically, the global variable kernel_debug_active is checked and is set it calls kperf_kdebug_handler withe Kdebug code and address of the kernel frame calling. If the Kdebug code matches one selected it gets the "actions" configured as a bitmap (check osfmk/kperf/action.h for the options).
Kperf has a sysctl MIB table also: (as root) sysctl kperf. These code can be found in osfmk/kperf/kperfbsd.c.
Moreover, a subset of Kperfs functionality resides in kpc, which provides information about machine performance counters.
ProcessMonitor
ProcessMonitor is a very useful tool to check the process related actions a process is performing (for example, monitor which new processes a process is creating).
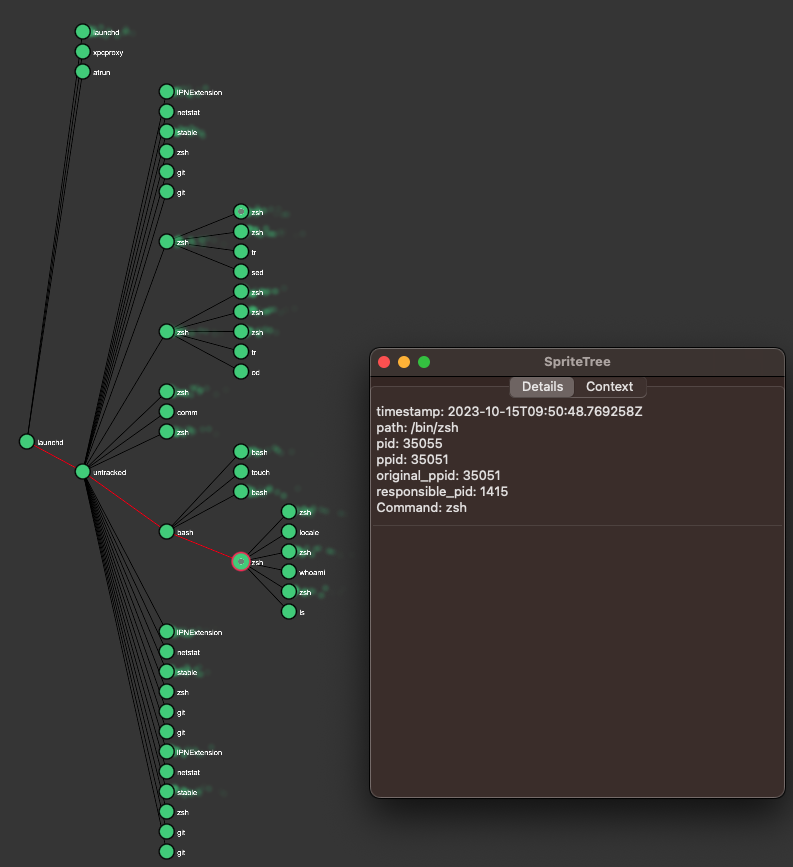
SpriteTree
SpriteTree is a tool to prints the relations between processes.
You need to monitor your mac with a command like sudo eslogger fork exec rename create > cap.json (the terminal launching this required FDA). And then you can load the json in this tool to view all the relations:
FileMonitor
FileMonitor allows to monitor file events (such as creation, modifications, and deletions) providing detailed information about such events.
Crescendo
Crescendo is a GUI tool with the look and feel Windows users may know from Microsoft Sysinternal’s Procmon. This tool allows the recording of various event types to be started and stopped, allows for the filtering of these events by categories such as file, process, network, etc., and provides the functionality to save the events recorded in a json format.
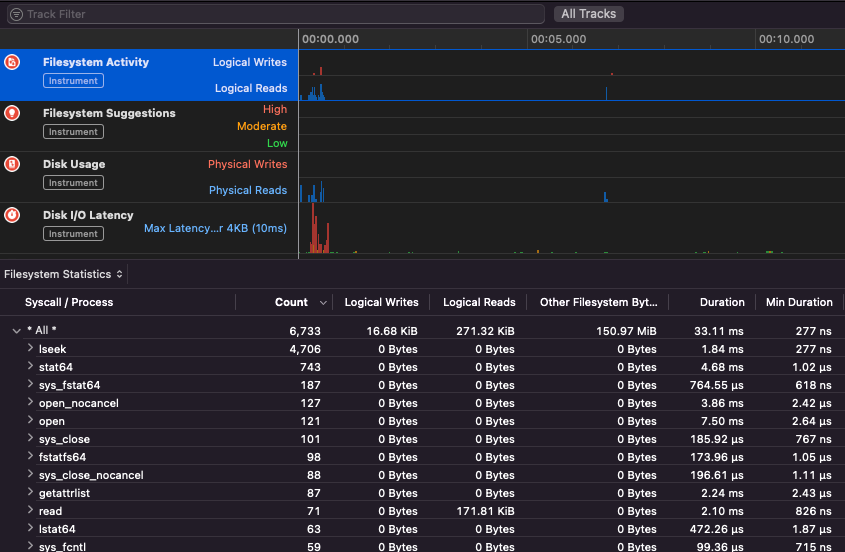
Apple Instruments
Apple Instruments are part of Xcode’s Developer tools – used for monitoring application performance, identifying memory leaks and tracking filesystem activity.
fs_usage
Allows to follow actions performed by processes:
fs_usage -w -f filesys ls #This tracks filesystem actions of proccess names containing ls
fs_usage -w -f network curl #This tracks network actions
TaskExplorer
Taskexplorer is useful to see the libraries used by a binary, the files it's using and the network connections.
It also checks the binary processes against virustotal and show information about the binary.
PT_DENY_ATTACH
In this blog post you can find an example about how to debug a running daemon that used PT_DENY_ATTACH to prevent debugging even if SIP was disabled.
lldb
lldb is the de facto tool for macOS binary debugging.
lldb ./malware.bin
lldb -p 1122
lldb -n malware.bin
lldb -n malware.bin --waitfor
You can set intel flavour when using lldb creating a file called .lldbinit in your home folder with the following line:
settings set target.x86-disassembly-flavor intel
{% hint style="warning" %}
Inside lldb, dump a process with process save-core
{% endhint %}
| (lldb) Command | Description |
| run (r) | Starting execution, which will continue unabated until a breakpoint is hit or the process terminates. |
| process launch --stop-at-entry | Strt execution stopping at the entry point |
| continue (c) | Continue execution of the debugged process. |
| nexti (n / ni) | Execute the next instruction. This command will skip over function calls. |
| stepi (s / si) | Execute the next instruction. Unlike the nexti command, this command will step into function calls. |
| finish (f) | Execute the rest of the instructions in the current function (“frame”) return and halt. |
| control + c | Pause execution. If the process has been run (r) or continued (c), this will cause the process to halt ...wherever it is currently executing. |
| breakpoint (b) |
breakpoint delete <num> |
| help | help breakpoint #Get help of breakpoint command help memory write #Get help to write into the memory |
| reg | reg read reg read $rax reg read $rax --format <format> reg write $rip 0x100035cc0 |
| x/s <reg/memory address> | Display the memory as a null-terminated string. |
| x/i <reg/memory address> | Display the memory as assembly instruction. |
| x/b <reg/memory address> | Display the memory as byte. |
| print object (po) | This will print the object referenced by the param po $raw
Note that most of Apple’s Objective-C APIs or methods return objects, and thus should be displayed via the “print object” (po) command. If po doesn't produce a meaningful output use |
| memory | memory read 0x000.... memory read $x0+0xf2a memory write 0x100600000 -s 4 0x41414141 #Write AAAA in that address memory write -f s $rip+0x11f+7 "AAAA" #Write AAAA in the addr |
| disassembly | dis #Disas current function dis -n <funcname> #Disas func dis -n <funcname> -b <basename> #Disas func |
| parray | parray 3 (char **)$x1 # Check array of 3 components in x1 reg |
| image dump sections | Print map of the current process memory |
| image dump symtab <library> | image dump symtab CoreNLP #Get the address of all the symbols from CoreNLP |
{% hint style="info" %}
When calling the objc_sendMsg function, the rsi register holds the name of the method as a null-terminated (“C”) string. To print the name via lldb do:
(lldb) x/s $rsi: 0x1000f1576: "startMiningWithPort:password:coreCount:slowMemory:currency:"
(lldb) print (char*)$rsi:
(char *) $1 = 0x00000001000f1576 "startMiningWithPort:password:coreCount:slowMemory:currency:"
(lldb) reg read $rsi: rsi = 0x00000001000f1576 "startMiningWithPort:password:coreCount:slowMemory:currency:"
{% endhint %}
Anti-Dynamic Analysis
VM detection
- The command
sysctl hw.modelreturns "Mac" when the host is a MacOS but something different when it's a VM. - Playing with the values of
hw.logicalcpuandhw.physicalcpusome malwares try to detect if it's a VM. - Some malwares can also detect if the machine is VMware based on the MAC address (00:50:56).
- It's also possible to find if a process is being debugged with a simple code such us:
if(P_TRACED == (info.kp_proc.p_flag & P_TRACED)){ //process being debugged }
- It can also invoke the
ptracesystem call with thePT_DENY_ATTACHflag. This prevents a debugger from attaching and tracing.- You can check if the
sysctlorptracefunction is being imported (but the malware could import it dynamically) - As noted in this writeup, “Defeating Anti-Debug Techniques: macOS ptrace variants” :
“The message Process # exited with status = 45 (0x0000002d) is usually a tell-tale sign that the debug target is using PT_DENY_ATTACH”
- You can check if the
Core Dumps
Core dumps are created if:
kern.coredumpsysctl is set to 1 (by default)- If the process wasn't suid/sgid or
kern.sugid_coredumpis 1 (by default is 0) - The
AS_CORElimit allows the operation. It's possible to suppress code dumps creation by callingulimit -c 0and re-enable them withulimit -c unlimited.
In those cases the core dumps is generated according to kern.corefile sysctl and stored usually in /cores/core/.%P.
Fuzzing
ReportCrash
ReportCrash analyzes crashing processes and saves a crash report to disk. A crash report contains information that can help a developer diagnose the cause of a crash.
For applications and other processes running in the per-user launchd context, ReportCrash runs as a LaunchAgent and saves crash reports in the user's ~/Library/Logs/DiagnosticReports/
For daemons, other processes running in the system launchd context and other privileged processes, ReportCrash runs as a LaunchDaemon and saves crash reports in the system's /Library/Logs/DiagnosticReports
If you are worried about crash reports being sent to Apple you can disable them. If not, crash reports can be useful to figure out how a server crashed.
#To disable crash reporting:
launchctl unload -w /System/Library/LaunchAgents/com.apple.ReportCrash.plist
sudo launchctl unload -w /System/Library/LaunchDaemons/com.apple.ReportCrash.Root.plist

#To re-enable crash reporting:
launchctl load -w /System/Library/LaunchAgents/com.apple.ReportCrash.plist
sudo launchctl load -w /System/Library/LaunchDaemons/com.apple.ReportCrash.Root.plist
Sleep
While fuzzing in a MacOS it's important to not allow the Mac to sleep:
- systemsetup -setsleep Never
- pmset, System Preferences
- KeepingYouAwake
SSH Disconnect
If you are fuzzing via a SSH connection it's important to make sure the session isn't going to day. So change the sshd_config file with:
- TCPKeepAlive Yes
- ClientAliveInterval 0
- ClientAliveCountMax 0
sudo launchctl unload /System/Library/LaunchDaemons/ssh.plist
sudo launchctl load -w /System/Library/LaunchDaemons/ssh.plist
Internal Handlers
Checkout the following page to find out how you can find which app is responsible of handling the specified scheme or protocol:
{% content-ref url="../macos-file-extension-apps.md" %} macos-file-extension-apps.md {% endcontent-ref %}
Enumerating Network Processes
This interesting to find processes that are managing network data:
dtrace -n 'syscall::recv*:entry { printf("-> %s (pid=%d)", execname, pid); }' >> recv.log
#wait some time
sort -u recv.log > procs.txt
cat procs.txt
Or use netstat or lsof
Libgmalloc
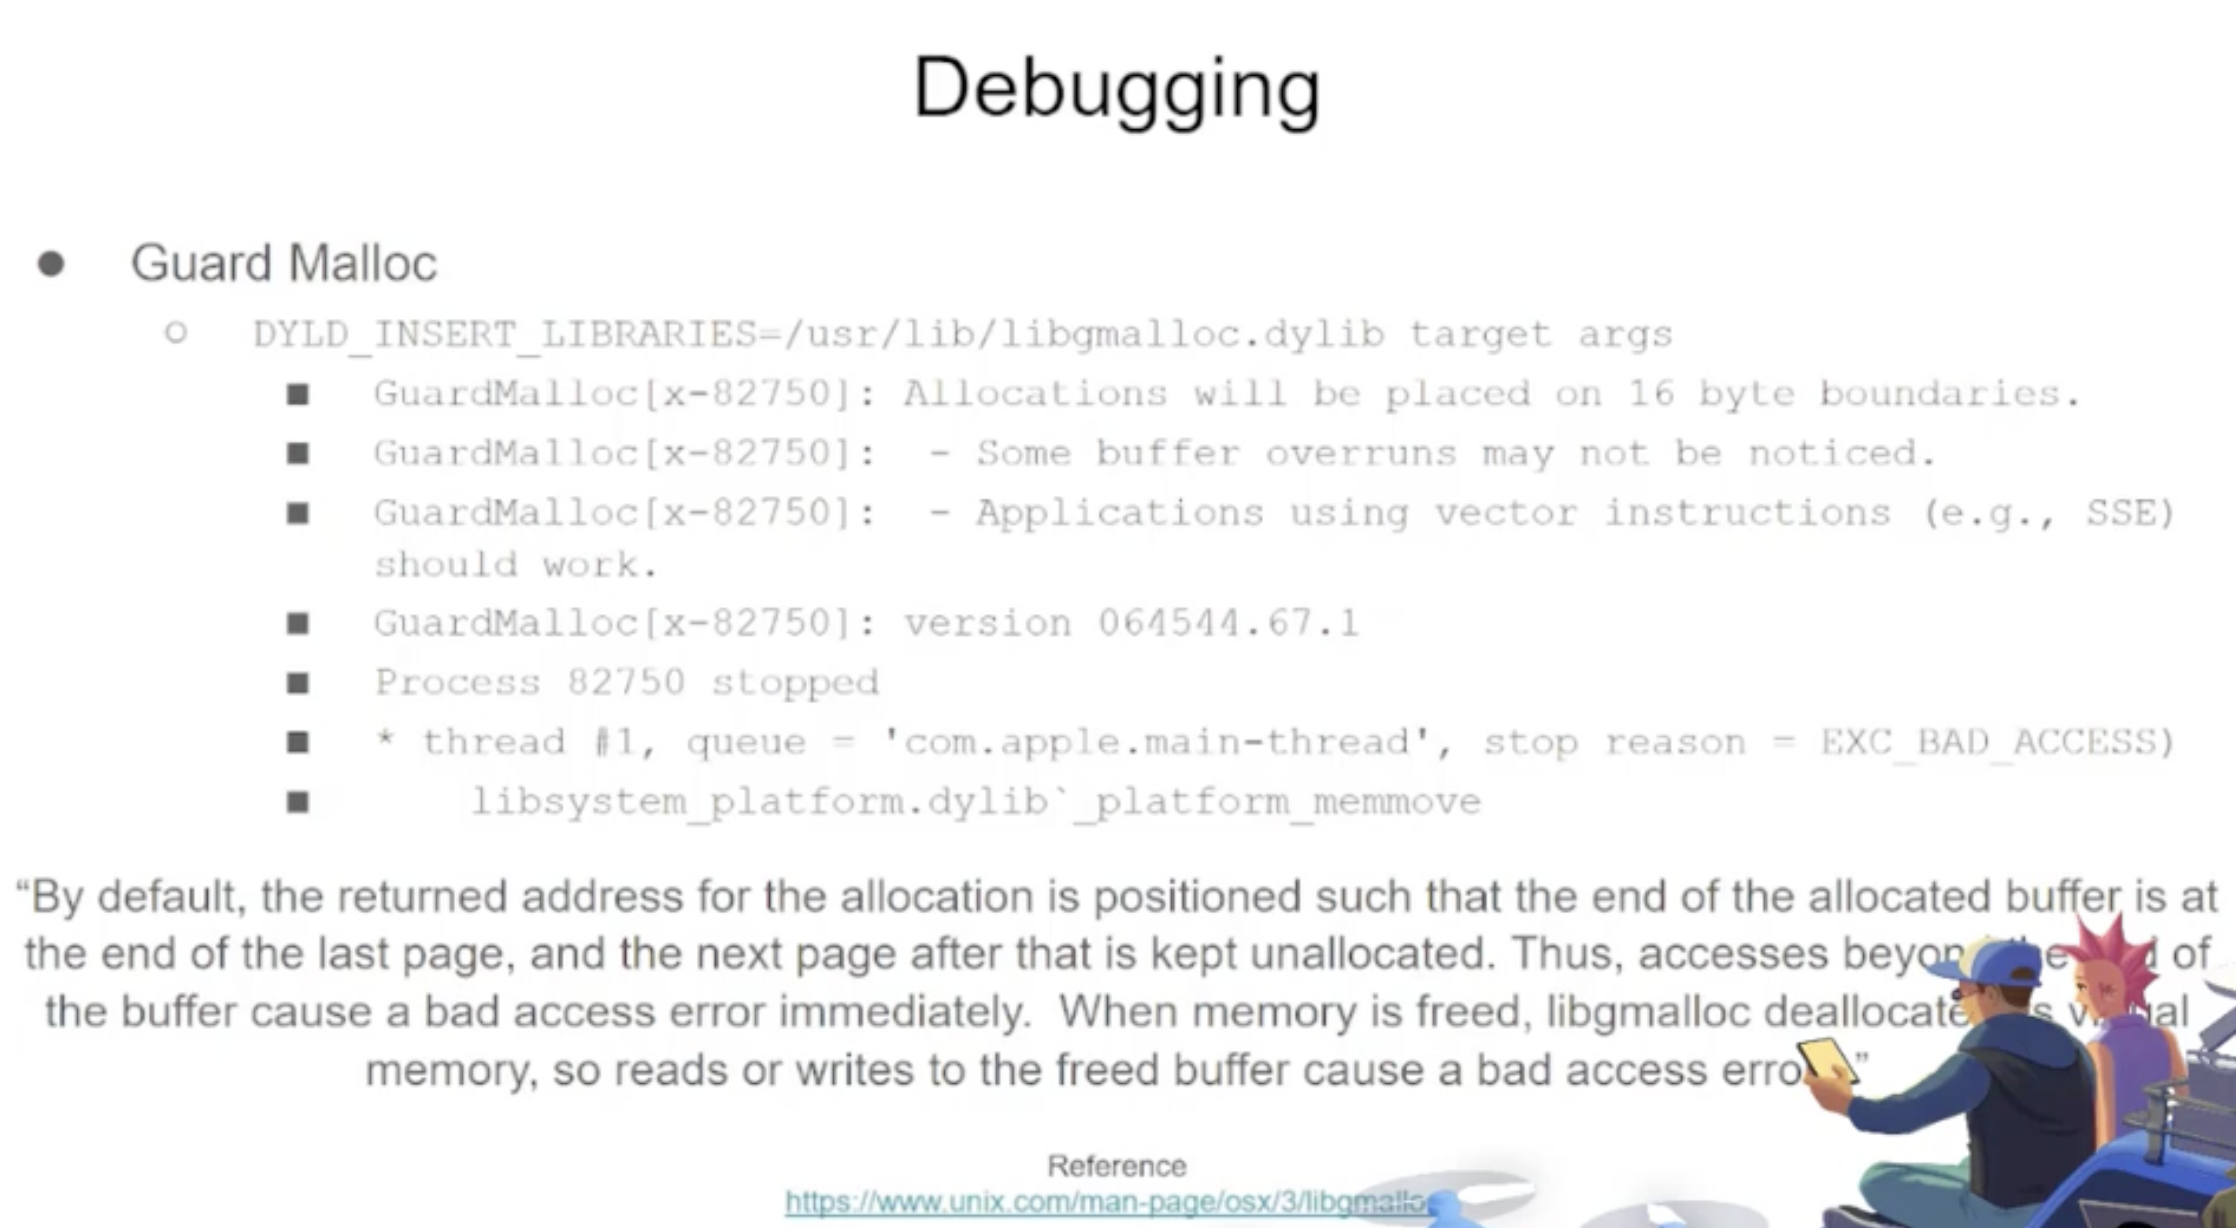
{% code overflow="wrap" %}
lldb -o "target create `which some-binary`" -o "settings set target.env-vars DYLD_INSERT_LIBRARIES=/usr/lib/libgmalloc.dylib" -o "run arg1 arg2" -o "bt" -o "reg read" -o "dis -s \$pc-32 -c 24 -m -F intel" -o "quit"
{% endcode %}
Fuzzers
AFL++
Works for CLI tools
Litefuzz
It "just works" with macOS GUI tools. Note some some macOS apps have some specific requirements like unique filenames, the right extension, need to read the files from the sandbox (~/Library/Containers/com.apple.Safari/Data)...
Some examples:
{% code overflow="wrap" %}
# iBooks
litefuzz -l -c "/System/Applications/Books.app/Contents/MacOS/Books FUZZ" -i files/epub -o crashes/ibooks -t /Users/test/Library/Containers/com.apple.iBooksX/Data/tmp -x 10 -n 100000 -ez

# -l : Local
# -c : cmdline with FUZZ word (if not stdin is used)
# -i : input directory or file
# -o : Dir to output crashes
# -t : Dir to output runtime fuzzing artifacts
# -x : Tmeout for the run (default is 1)
# -n : Num of fuzzing iterations (default is 1)
# -e : enable second round fuzzing where any crashes found are reused as inputs
# -z : enable malloc debug helpers

# Font Book
litefuzz -l -c "/System/Applications/Font Book.app/Contents/MacOS/Font Book FUZZ" -i input/fonts -o crashes/font-book -x 2 -n 500000 -ez

# smbutil (using pcap capture)
litefuzz -lk -c "smbutil view smb://localhost:4455" -a tcp://localhost:4455 -i input/mac-smb-resp -p -n 100000 -z

# screensharingd (using pcap capture)
litefuzz -s -a tcp://localhost:5900 -i input/screenshared-session --reportcrash screensharingd -p -n 100000
{% endcode %}
More Fuzzing MacOS Info
- https://www.youtube.com/watch?v=T5xfL9tEg44
- https://github.com/bnagy/slides/blob/master/OSXScale.pdf
- https://github.com/bnagy/francis/tree/master/exploitaben
- https://github.com/ant4g0nist/crashwrangler
References
- OS X Incident Response: Scripting and Analysis
- https://www.youtube.com/watch?v=T5xfL9tEg44
- https://taomm.org/vol1/analysis.html
- The Art of Mac Malware: The Guide to Analyzing Malicious Software
{% hint style="success" %}
Learn & practice AWS Hacking: HackTricks Training AWS Red Team Expert (ARTE)
Learn & practice GCP Hacking:  HackTricks Training GCP Red Team Expert (GRTE)
Support HackTricks
- Check the subscription plans!
- Join the 💬 Discord group or the telegram group or follow us on Twitter 🐦 @hacktricks_live.
- Share hacking tricks by submitting PRs to the HackTricks and HackTricks Cloud github repos.
