28 KiB
macOS Apps - Inspecting, debugging and Fuzzing
☁️ HackTricks Cloud ☁️ -🐦 Twitter 🐦 - 🎙️ Twitch 🎙️ - 🎥 Youtube 🎥
- Do you work in a cybersecurity company? Do you want to see your company advertised in HackTricks? or do you want to have access to the latest version of the PEASS or download HackTricks in PDF? Check the SUBSCRIPTION PLANS!
- Discover The PEASS Family, our collection of exclusive NFTs
- Get the official PEASS & HackTricks swag
- Join the 💬 Discord group or the telegram group or follow me on Twitter 🐦@carlospolopm.
- Share your hacking tricks by submitting PRs to the hacktricks repo and hacktricks-cloud repo.
Static Analysis
otool
otool -L /bin/ls #List dynamically linked libraries
otool -tv /bin/ps #Decompile application
objdump
objdump -m --dylibs-used /bin/ls #List dynamically linked libraries
objdump -m -h /bin/ls # Get headers information
objdump -m --syms /bin/ls # Check if the symbol table exists to get function names
objdump -m --full-contents /bin/ls # Dump every section
objdump -d /bin/ls # Dissasemble the binary
jtool2
The tool can be used as a replacement for codesign, otool, and objdump, and provides a few additional features.
# Install
brew install --cask jtool2

jtool2 -l /bin/ls # Get commands (headers)
jtool2 -L /bin/ls # Get libraries
jtool2 -S /bin/ls # Get symbol info
jtool2 -d /bin/ls # Dump binary
jtool2 -D /bin/ls # Decompile binary

# Get signature information
ARCH=x86_64 jtool2 --sig /System/Applications/Automator.app/Contents/MacOS/Automator
Codesign
# Get signer
codesign -vv -d /bin/ls 2>&1 | grep -E "Authority|TeamIdentifier"

# Check if the app’s contents have been modified
codesign --verify --verbose /Applications/Safari.app

# Get entitlements from the binary
codesign -d --entitlements :- /System/Applications/Automator.app # Check the TCC perms

# Check if the signature is valid
spctl --assess --verbose /Applications/Safari.app

# Sign a binary
codesign -s <cert-name-keychain> toolsdemo
SuspiciousPackage
SuspiciousPackage is a tool useful to inspect .pkg files (installers) and see what is inside before installing it.
These installers have preinstall and postinstall bash scripts that malware authors usually abuse to persist the malware.
hdiutil
This tool allows to mount Apple disk images (.dmg) files to inspect them before running anything:
hdiutil attach ~/Downloads/Firefox\ 58.0.2.dmg
It will be mounted in /Volumes
Objective-C
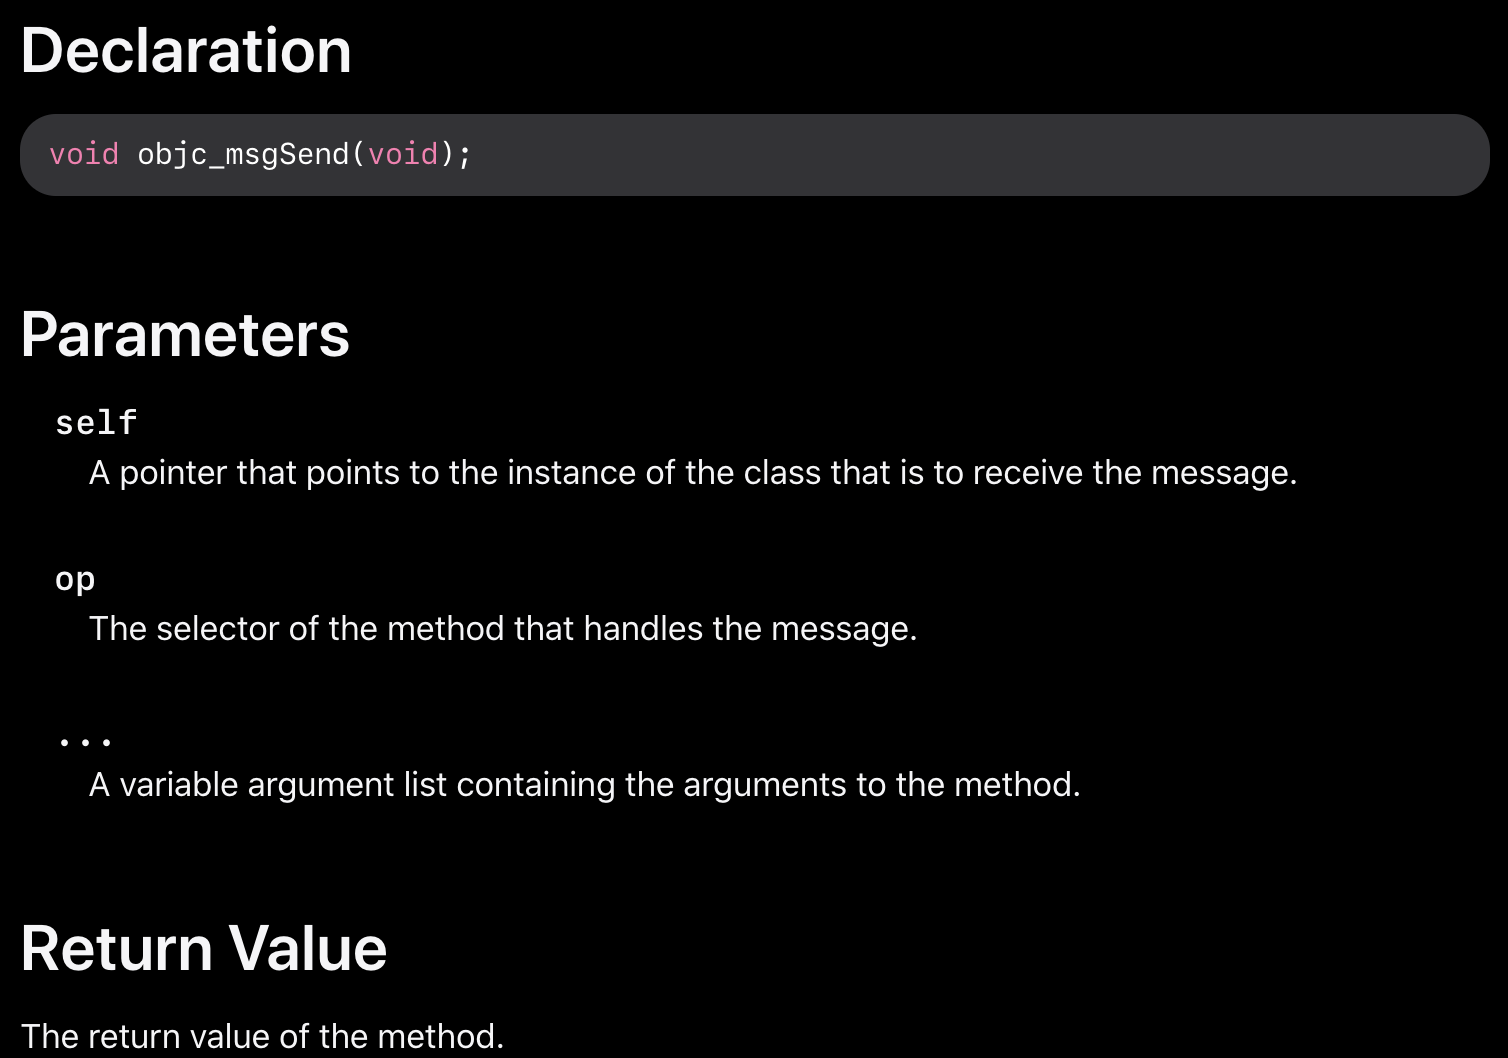
When a function is called in a binary that uses objective-C, the compiled code instead of calling that function, it will call objc_msgSend. Which will be calling the final function:
The params this function expects are:
- The first parameter (self) is "a pointer that points to the instance of the class that is to receive the message". Or more simply put, it’s the object that the method is being invoked upon. If the method is a class method, this will be an instance of the class object (as a whole), whereas for an instance method, self will point to an instantiated instance of the class as an object.
- The second parameter, (op), is "the selector of the method that handles the message". Again, more simply put, this is just the name of the method.
- The remaining parameters are any values that are required by the method (op).
| Argument | Register | (for) objc_msgSend |
|---|---|---|
| 1st argument | rdi | self: object that the method is being invoked upon |
| 2nd argument | rsi | op: name of the method |
| 3rd argument | rdx | 1st argument to the method |
| 4th argument | rcx | 2nd argument to the method |
| 5th argument | r8 | 3rd argument to the method |
| 6th argument | r9 | 4th argument to the method |
| 7th+ argument | rsp+ |
5th+ argument to the method |
Packed binaries
- Check for high entropy
- Check the strings (is there is almost no understandable string, packed)
- The UPX packer for MacOS generates a section called "__XHDR"
Dynamic Analysis
{% hint style="warning" %}
Note that in order to debug binaries, SIP needs to be disabled (csrutil disable or csrutil enable --without debug) or to copy the binaries to a temporary folder and remove the signature with codesign --remove-signature <binary-path> or allow the debugging of the binary (you can use this script)
{% endhint %}
{% hint style="warning" %}
Note that in order to instrument system binaries, (such as cloudconfigurationd) on macOS, SIP must be disabled (just removing the signature won't work).
{% endhint %}
Unified Logs
MacOS generates a lot of logs that can be very useful when running an application trying to understand what is it doing.
Moreover, the are some logs that will contain the tag <private> to hide some user or computer identifiable information. However, it's possible to install a certificate to disclose this information. Follow the explanations from here.
Hopper
Left panel
In the left panel of hopper it's possible to see the symbols (Labels) of the binary, the list of procedures and functions (Proc) and the strings (Str). Those aren't all the strings but the ones defined in several parts of the Mac-O file (like cstring or objc_methname).
Middle panel
In the middle panel you can see the dissasembled code. And you can see it a raw disassemble, as graph, as decompiled and as binary by clicking on the respective icon:

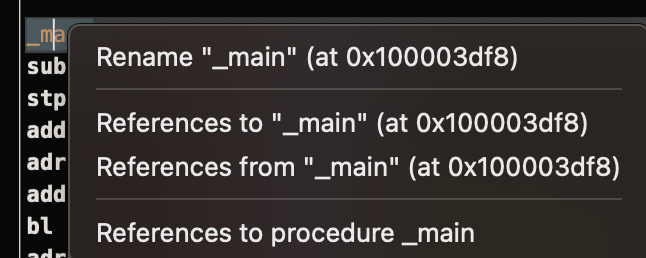
Right clicking in a code object you can see references to/from that object or even change its name (this doesn't work in decompiled pseudocode):

Moreover, in the middle down you can write python commands.
Right panel
In the right panel you can see interesting information such as the navigation history (so you know how you arrived at the current situation), the call graph where you can see all the functions that call this function and all the functions that this function calls, and local variables information.
dtruss
dtruss -c ls #Get syscalls of ls
dtruss -c -p 1000 #get syscalls of PID 1000
ktrace
You can use this one even with SIP activated
ktrace trace -s -S -t c -c ls | grep "ls("
dtrace
It allows users access to applications at an extremely low level and provides a way for users to trace programs and even change their execution flow. Dtrace uses probes which are placed throughout the kernel and are at locations such as the beginning and end of system calls.
DTrace uses the dtrace_probe_create function to create a probe for each system call. These probes can be fired in the entry and exit point of each system call. The interaction with DTrace occur through /dev/dtrace which is only available for the root user.
The available probes of dtrace can be obtained with:
dtrace -l | head
   ID   PROVIDER            MODULE                          FUNCTION NAME
    1     dtrace                                                     BEGIN
    2     dtrace                                                     END
    3     dtrace                                                     ERROR
   43    profile                                                     profile-97
   44    profile                                                     profile-199
The probe name consists of four parts: the provider, module, function, and name (fbt:mach_kernel:ptrace:entry). If you not specifies some part of the name, Dtrace will apply that part as a wildcard.
To configure DTrace to activate probes and to specify what actions to perform when they fire, we will need to use the D language.
A more detailed explanation and more examples can be found in https://illumos.org/books/dtrace/chp-intro.html
Examples
Run man -k dtrace to list the DTrace scripts available. Example: sudo dtruss -n binary
- In line
#Count the number of syscalls of each running process
sudo dtrace -n 'syscall:::entry {@[execname] = count()}'
- script
syscall:::entry
/pid == $1/
{
}

#Log every syscall of a PID
sudo dtrace -s script.d 1234
syscall::open:entry
{
    printf("%s(%s)", probefunc, copyinstr(arg0));
}
syscall::close:entry
{
        printf("%s(%d)\n", probefunc, arg0);
}

#Log files opened and closed by a process
sudo dtrace -s b.d -c "cat /etc/hosts"
syscall:::entry
{
        ;
}
syscall:::return
{
        printf("=%d\n", arg1);
}

#Log sys calls with values
sudo dtrace -s syscalls_info.d -c "cat /etc/hosts"
ProcessMonitor
ProcessMonitor is a very useful tool to check the process related actions a process is performing (for example, monitor which new processes a process is creating).
FileMonitor
FileMonitor allows to monitor file events (such as creation, modifications, and deletions) providing detailed information about such events.
fs_usage
Allows to follow actions performed by processes:
fs_usage -w -f filesys ls #This tracks filesystem actions of proccess names containing ls
fs_usage -w -f network curl #This tracks network actions
TaskExplorer
Taskexplorer is useful to see the libraries used by a binary, the files it's using and the network connections.
It also checks the binary processes against virustotal and show information about the binary.
lldb
lldb is the de facto tool for macOS binary debugging.
lldb ./malware.bin
lldb -p 1122
lldb -n malware.bin
lldb -n malware.bin --waitfor
| (lldb) Command | Description |
|---|---|
| run (r) | Starting execution, which will continue unabated until a breakpoint is hit or the process terminates. |
| continue (c) | Continue execution of the debugged process. |
| nexti (n / ni) | Execute the next instruction. This command will skip over function calls. |
| stepi (s / si) | Execute the next instruction. Unlike the nexti command, this command will step into function calls. |
| finish (f) | Execute the rest of the instructions in the current function (“frame”) return and halt. |
| control + c | Pause execution. If the process has been run (r) or continued (c), this will cause the process to halt ...wherever it is currently executing. |
| breakpoint (b) | b main b -[NSDictionary objectForKey:] b 0x0000000100004bd9 br l #Breakpoint list br e/dis <num> #Enable/Disable breakpoint breakpoint delete <num> |
| help | help breakpoint #Get help of breakpoint command help memory write #Get help to write into the memory |
| reg | reg read reg read $rax reg write $rip 0x100035cc0 |
| x/s <reg/memory address> | Display the memory as a null-terminated string. |
| x/i <reg/memory address> | Display the memory as assembly instruction. |
| x/b <reg/memory address> | Display the memory as byte. |
| print object (po) | This will print the object referenced by the param po $raw
Note that most of Apple’s Objective-C APIs or methods return objects, and thus should be displayed via the “print object” (po) command. If po doesn't produce a meaningful output use |
| memory | memory read 0x000.... |
| disassembly | dis #Disas current function |
| parray | parray 3 (char **)$x1 # Check array of 3 components in x1 reg |
{% hint style="info" %}
When calling the objc_sendMsg function, the rsi register holds the name of the method as a null-terminated (“C”) string. To print the name via lldb do:
(lldb) x/s $rsi: 0x1000f1576: "startMiningWithPort:password:coreCount:slowMemory:currency:"
(lldb) print (char*)$rsi:
(char *) $1 = 0x00000001000f1576 "startMiningWithPort:password:coreCount:slowMemory:currency:"
(lldb) reg read $rsi: rsi = 0x00000001000f1576 "startMiningWithPort:password:coreCount:slowMemory:currency:"
{% endhint %}
Anti-Dynamic Analysis
VM detection
- The command
sysctl hw.modelreturns "Mac" when the host is a MacOS but something different when it's a VM. - Playing with the values of
hw.logicalcpuandhw.physicalcpusome malwares try to detect if it's a VM. - Some malwares can also detect if the machine is VMware based on the MAC address (00:50:56).
- It's also possible to find if a process is being debugged with a simple code such us:
if(P_TRACED == (info.kp_proc.p_flag & P_TRACED)){ //process being debugged }
- It can also invoke the
ptracesystem call with thePT_DENY_ATTACHflag. This prevents a debugger from attaching and tracing.- You can check if the
sysctlorptracefunction is being imported (but the malware could import it dynamically) - As noted in this writeup, “Defeating Anti-Debug Techniques: macOS ptrace variants” :
“The message Process # exited with status = 45 (0x0000002d) is usually a tell-tale sign that the debug target is using PT_DENY_ATTACH”
- You can check if the
Fuzzing
ReportCrash
ReportCrash analyzes crashing processes and saves a crash report to disk. A crash report contains information that can help a developer diagnose the cause of a crash.
For applications and other processes running in the per-user launchd context, ReportCrash runs as a LaunchAgent and saves crash reports in the user's ~/Library/Logs/DiagnosticReports/
For daemons, other processes running in the system launchd context and other privileged processes, ReportCrash runs as a LaunchDaemon and saves crash reports in the system's /Library/Logs/DiagnosticReports
If you are worried about crash reports being sent to Apple you can disable them. If not, crash reports can be useful to figure out how a server crashed.
#To disable crash reporting:
launchctl unload -w /System/Library/LaunchAgents/com.apple.ReportCrash.plist
sudo launchctl unload -w /System/Library/LaunchDaemons/com.apple.ReportCrash.Root.plist

#To re-enable crash reporting:
launchctl load -w /System/Library/LaunchAgents/com.apple.ReportCrash.plist
sudo launchctl load -w /System/Library/LaunchDaemons/com.apple.ReportCrash.Root.plist
Sleep
While fuzzing in a MacOS it's important to not allow the Mac to sleep:
- systemsetup -setsleep Never
- pmset, System Preferences
- KeepingYouAwake
SSH Disconnect
If you are fuzzing via a SSH connection it's important to make sure the session isn't going to day. So change the sshd_config file with:
- TCPKeepAlive Yes
- ClientAliveInterval 0
- ClientAliveCountMax 0
sudo launchctl unload /System/Library/LaunchDaemons/ssh.plist
sudo launchctl load -w /System/Library/LaunchDaemons/ssh.plist
Internal Handlers
Checkout the following page to find out how you can find which app is responsible of handling the specified scheme or protocol:
{% content-ref url="../macos-file-extension-apps.md" %} macos-file-extension-apps.md {% endcontent-ref %}
Enumerating Network Processes
This interesting to find processes that are managing network data:
dtrace -n 'syscall::recv*:entry { printf("-> %s (pid=%d)", execname, pid); }' >> recv.log
#wait some time
sort -u recv.log > procs.txt
cat procs.txt
Or use netstat or lsof
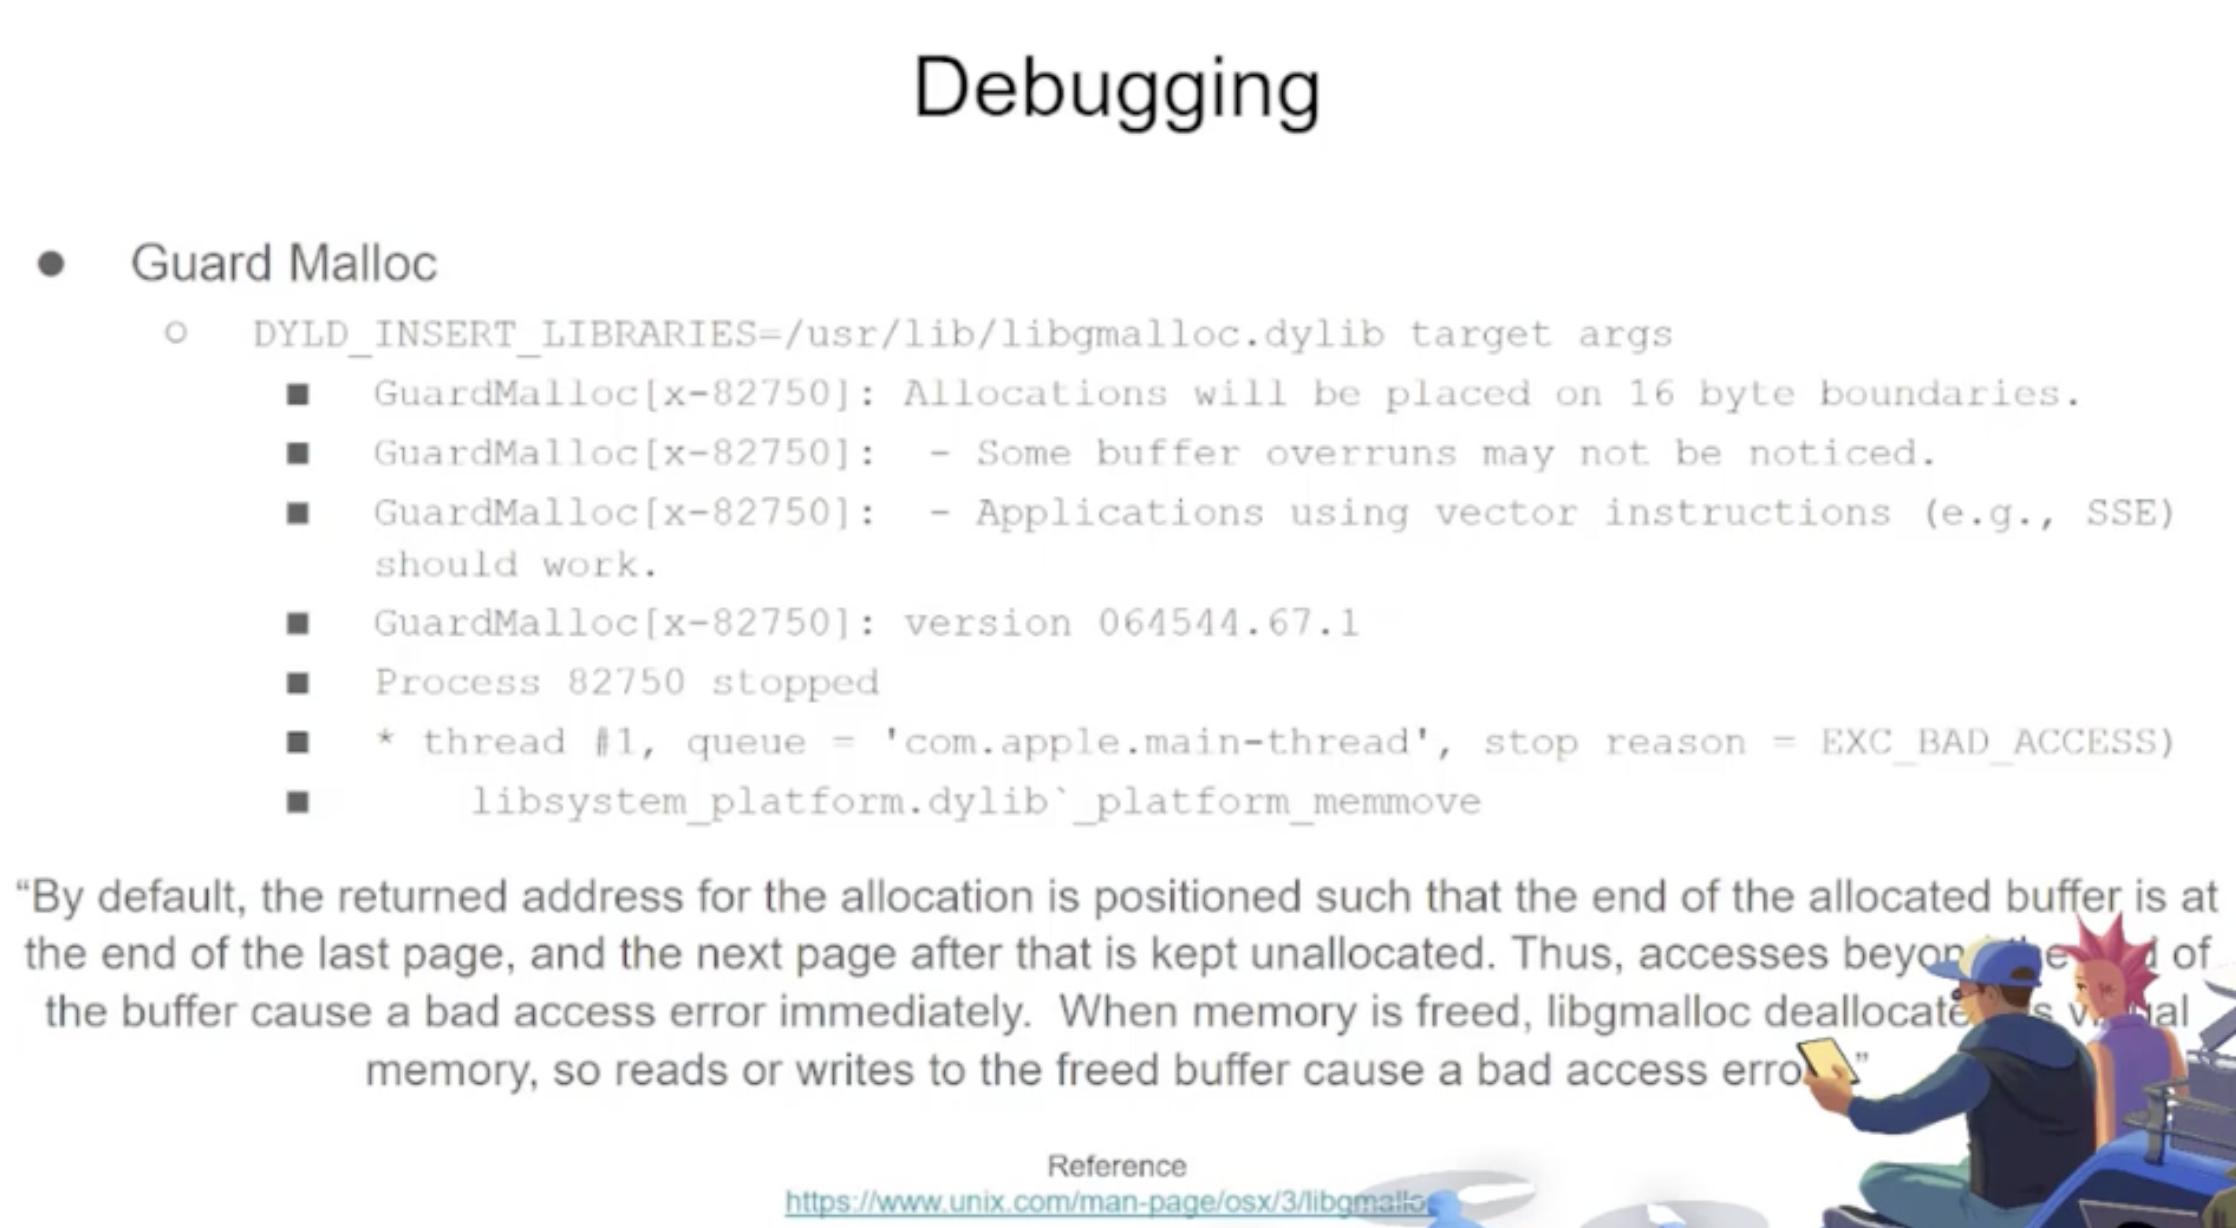
Libgmalloc

{% code overflow="wrap" %}
lldb -o "target create `which some-binary`" -o "settings set target.env-vars DYLD_INSERT_LIBRARIES=/usr/lib/libgmalloc.dylib" -o "run arg1 arg2" -o "bt" -o "reg read" -o "dis -s \$pc-32 -c 24 -m -F intel" -o "quit"
{% endcode %}
Fuzzers
AFL++
Works for CLI tools
Litefuzz
It "just works" with macOS GUI tools. Note some some macOS apps have some specific requirements like unique filenames, the right extension, need to read the files from the sandbox (~/Library/Containers/com.apple.Safari/Data)...
Some examples:
{% code overflow="wrap" %}
# iBooks
litefuzz -l -c "/System/Applications/Books.app/Contents/MacOS/Books FUZZ" -i files/epub -o crashes/ibooks -t /Users/test/Library/Containers/com.apple.iBooksX/Data/tmp -x 10 -n 100000 -ez

# -l : Local
# -c : cmdline with FUZZ word (if not stdin is used)
# -i : input directory or file
# -o : Dir to output crashes
# -t : Dir to output runtime fuzzing artifacts
# -x : Tmeout for the run (default is 1)
# -n : Num of fuzzing iterations (default is 1)
# -e : enable second round fuzzing where any crashes found are reused as inputs
# -z : enable malloc debug helpers

# Font Book
litefuzz -l -c "/System/Applications/Font Book.app/Contents/MacOS/Font Book FUZZ" -i input/fonts -o crashes/font-book -x 2 -n 500000 -ez

# smbutil (using pcap capture)
litefuzz -lk -c "smbutil view smb://localhost:4455" -a tcp://localhost:4455 -i input/mac-smb-resp -p -n 100000 -z

# screensharingd (using pcap capture)
litefuzz -s -a tcp://localhost:5900 -i input/screenshared-session --reportcrash screensharingd -p -n 100000
{% endcode %}
More Fuzzing MacOS Info
- https://www.youtube.com/watch?v=T5xfL9tEg44
- https://github.com/bnagy/slides/blob/master/OSXScale.pdf
- https://github.com/bnagy/francis/tree/master/exploitaben
- https://github.com/ant4g0nist/crashwrangler
References
- OS X Incident Response: Scripting and Analysis
- https://www.youtube.com/watch?v=T5xfL9tEg44
- https://taomm.org/vol1/analysis.html
☁️ HackTricks Cloud ☁️ -🐦 Twitter 🐦 - 🎙️ Twitch 🎙️ - 🎥 Youtube 🎥
- Do you work in a cybersecurity company? Do you want to see your company advertised in HackTricks? or do you want to have access to the latest version of the PEASS or download HackTricks in PDF? Check the SUBSCRIPTION PLANS!
- Discover The PEASS Family, our collection of exclusive NFTs
- Get the official PEASS & HackTricks swag
- Join the 💬 Discord group or the telegram group or follow me on Twitter 🐦@carlospolopm.
- Share your hacking tricks by submitting PRs to the hacktricks repo and hacktricks-cloud repo.
