# Objective

#11331 move the tracy dependency, this remove the line number to avoid
keeping the link in sync

---------

Co-authored-by: Alice Cecile <alice.i.cecile@gmail.com>
8 KiB
Profiling
Table of Contents
Runtime
Bevy has built-in tracing spans to make it cheap and easy to profile Bevy ECS systems, render logic, engine internals, and user app code. Enable the trace cargo feature to enable Bevy's built-in spans.
If you also want to include wgpu tracing spans when profiling, they are emitted at the tracing info level so you will need to make sure they are not filtered out by the LogSettings resource's filter member which defaults to wgpu=error. You can do this by setting the RUST_LOG=info environment variable when running your application.
You also need to select a tracing backend using one of the following cargo features.
⚠️ Note: for users of span based profilers
When your app is bottlenecked by the GPU, you may encounter frames that have multiple prepare-set systems all taking an unusually long time to complete, and all finishing at about the same time.
Improvements are planned to resolve this issue, you can find more details in the docs for prepare_windows.
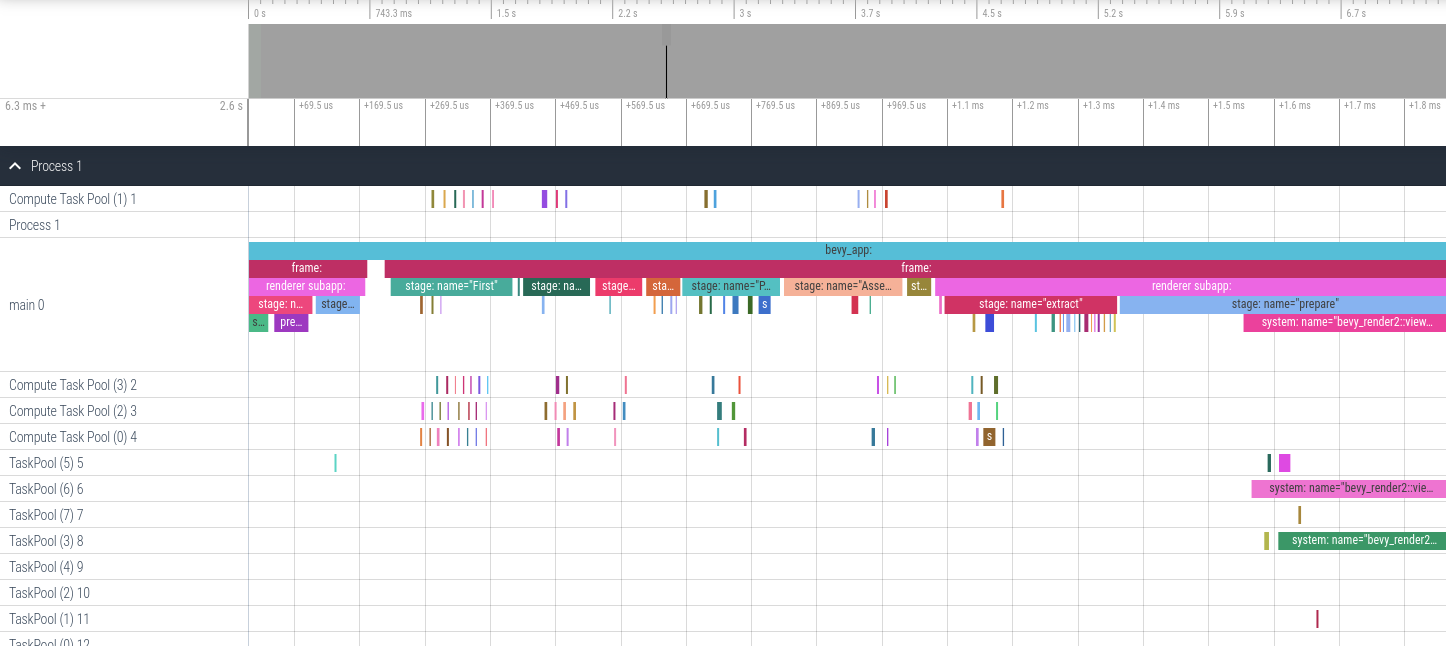
Chrome tracing format
cargo run --release --features bevy/trace_chrome
After running your app a json file in the "chrome tracing format" will be produced. You can open this file in your browser using https://ui.perfetto.dev. It will look something like this:
Tracy profiler
The Tracy profiling tool is:
A real time, nanosecond resolution, remote telemetry, hybrid frame and sampling profiler for games and other applications.
There are binaries available for Windows, and installation / build instructions for other operating systems can be found in the Tracy documentation PDF.
It has a command line capture tool that can record the execution of graphical applications, saving it as a profile file. Tracy has a GUI to inspect these profile files. The GUI app also supports live capture, showing you in real time the trace of your app. The version of tracy must be matched to the version of tracing-tracy used in bevy. A compatibility table can be found on crates.io and the version used can be found here.
In one terminal, run:
./capture-release -o my_capture.tracy
This will sit and wait for a tracy-instrumented application to start, and when it does, it will automatically connect and start capturing. Note that on Windows, the capture tool is called capture.exe.
Then run your application, enabling the trace_tracy feature:
cargo run --release --features bevy/trace_tracy
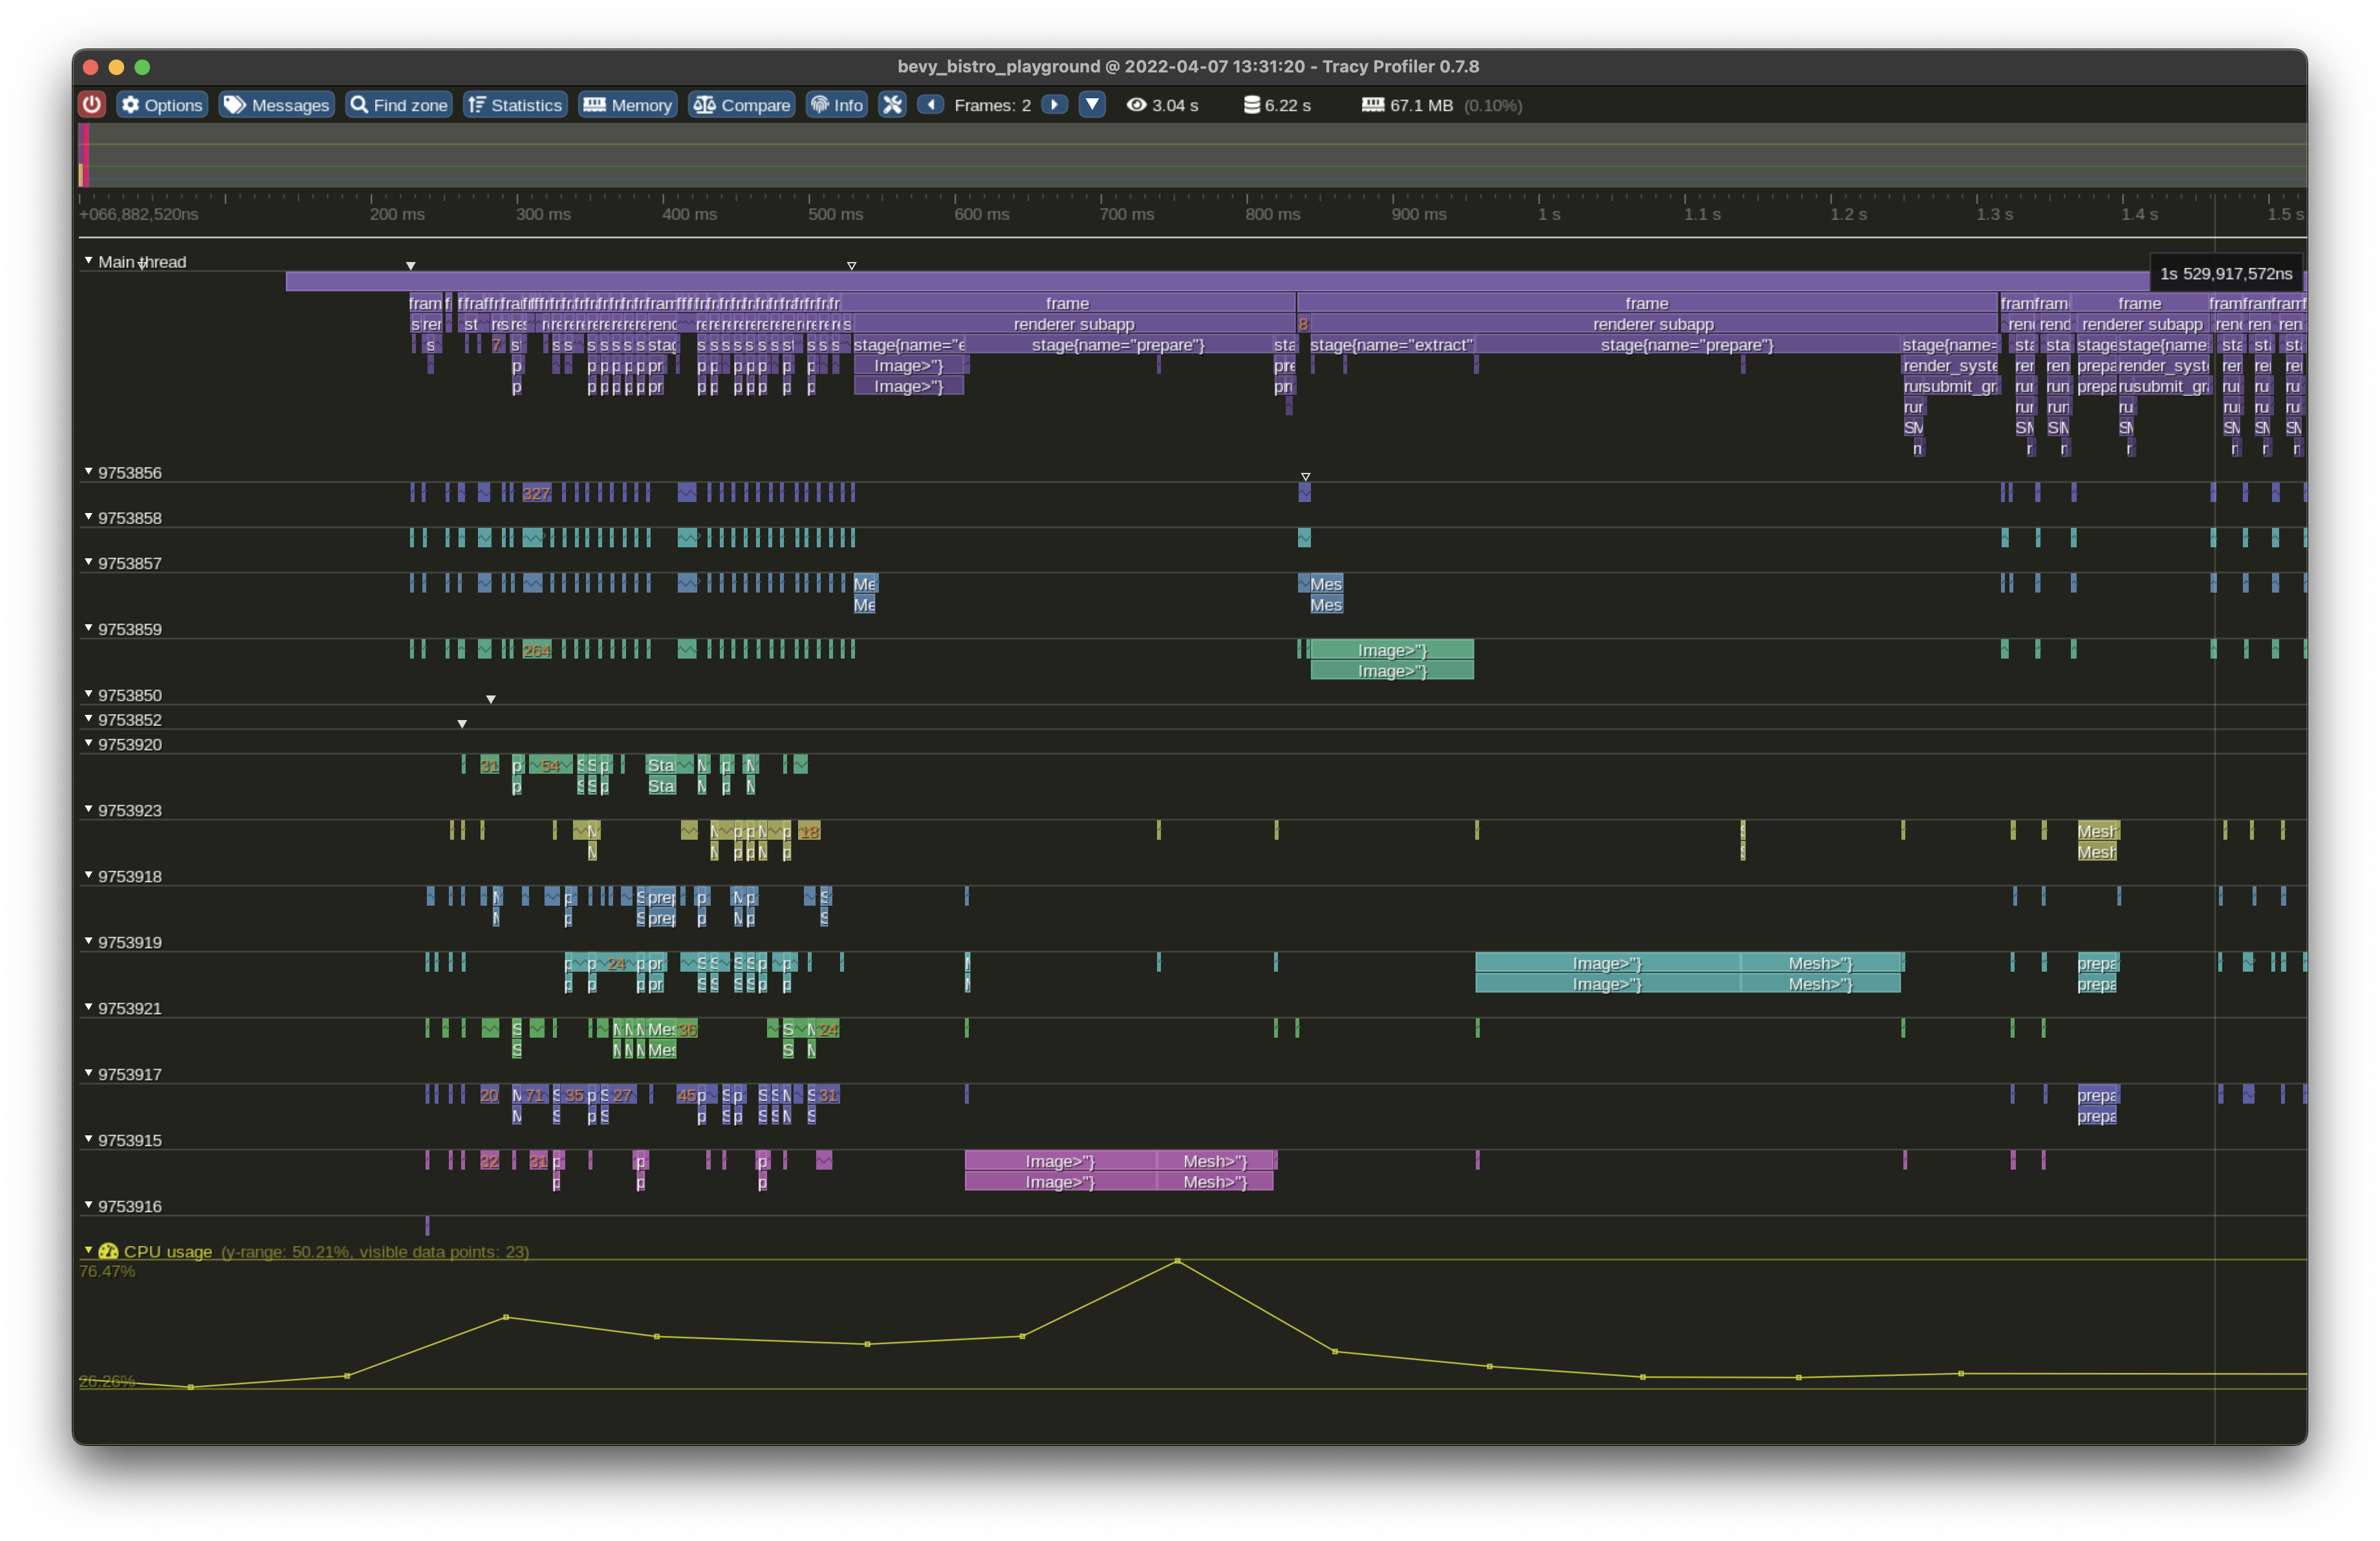
After running your app, you can open the captured profile file (my_capture.tracy in the example above) in the Tracy GUI application to see a timeline of the executed spans.
Alternatively, directly run the tracy GUI and then run your application, for live capture. However, beware that running the live capture on the same machine will be a competing graphical application, which may impact results. Pre-recording the profile data through the CLI tool is recommended for more accurate traces.
In any case, you'll see your trace in the GUI window:
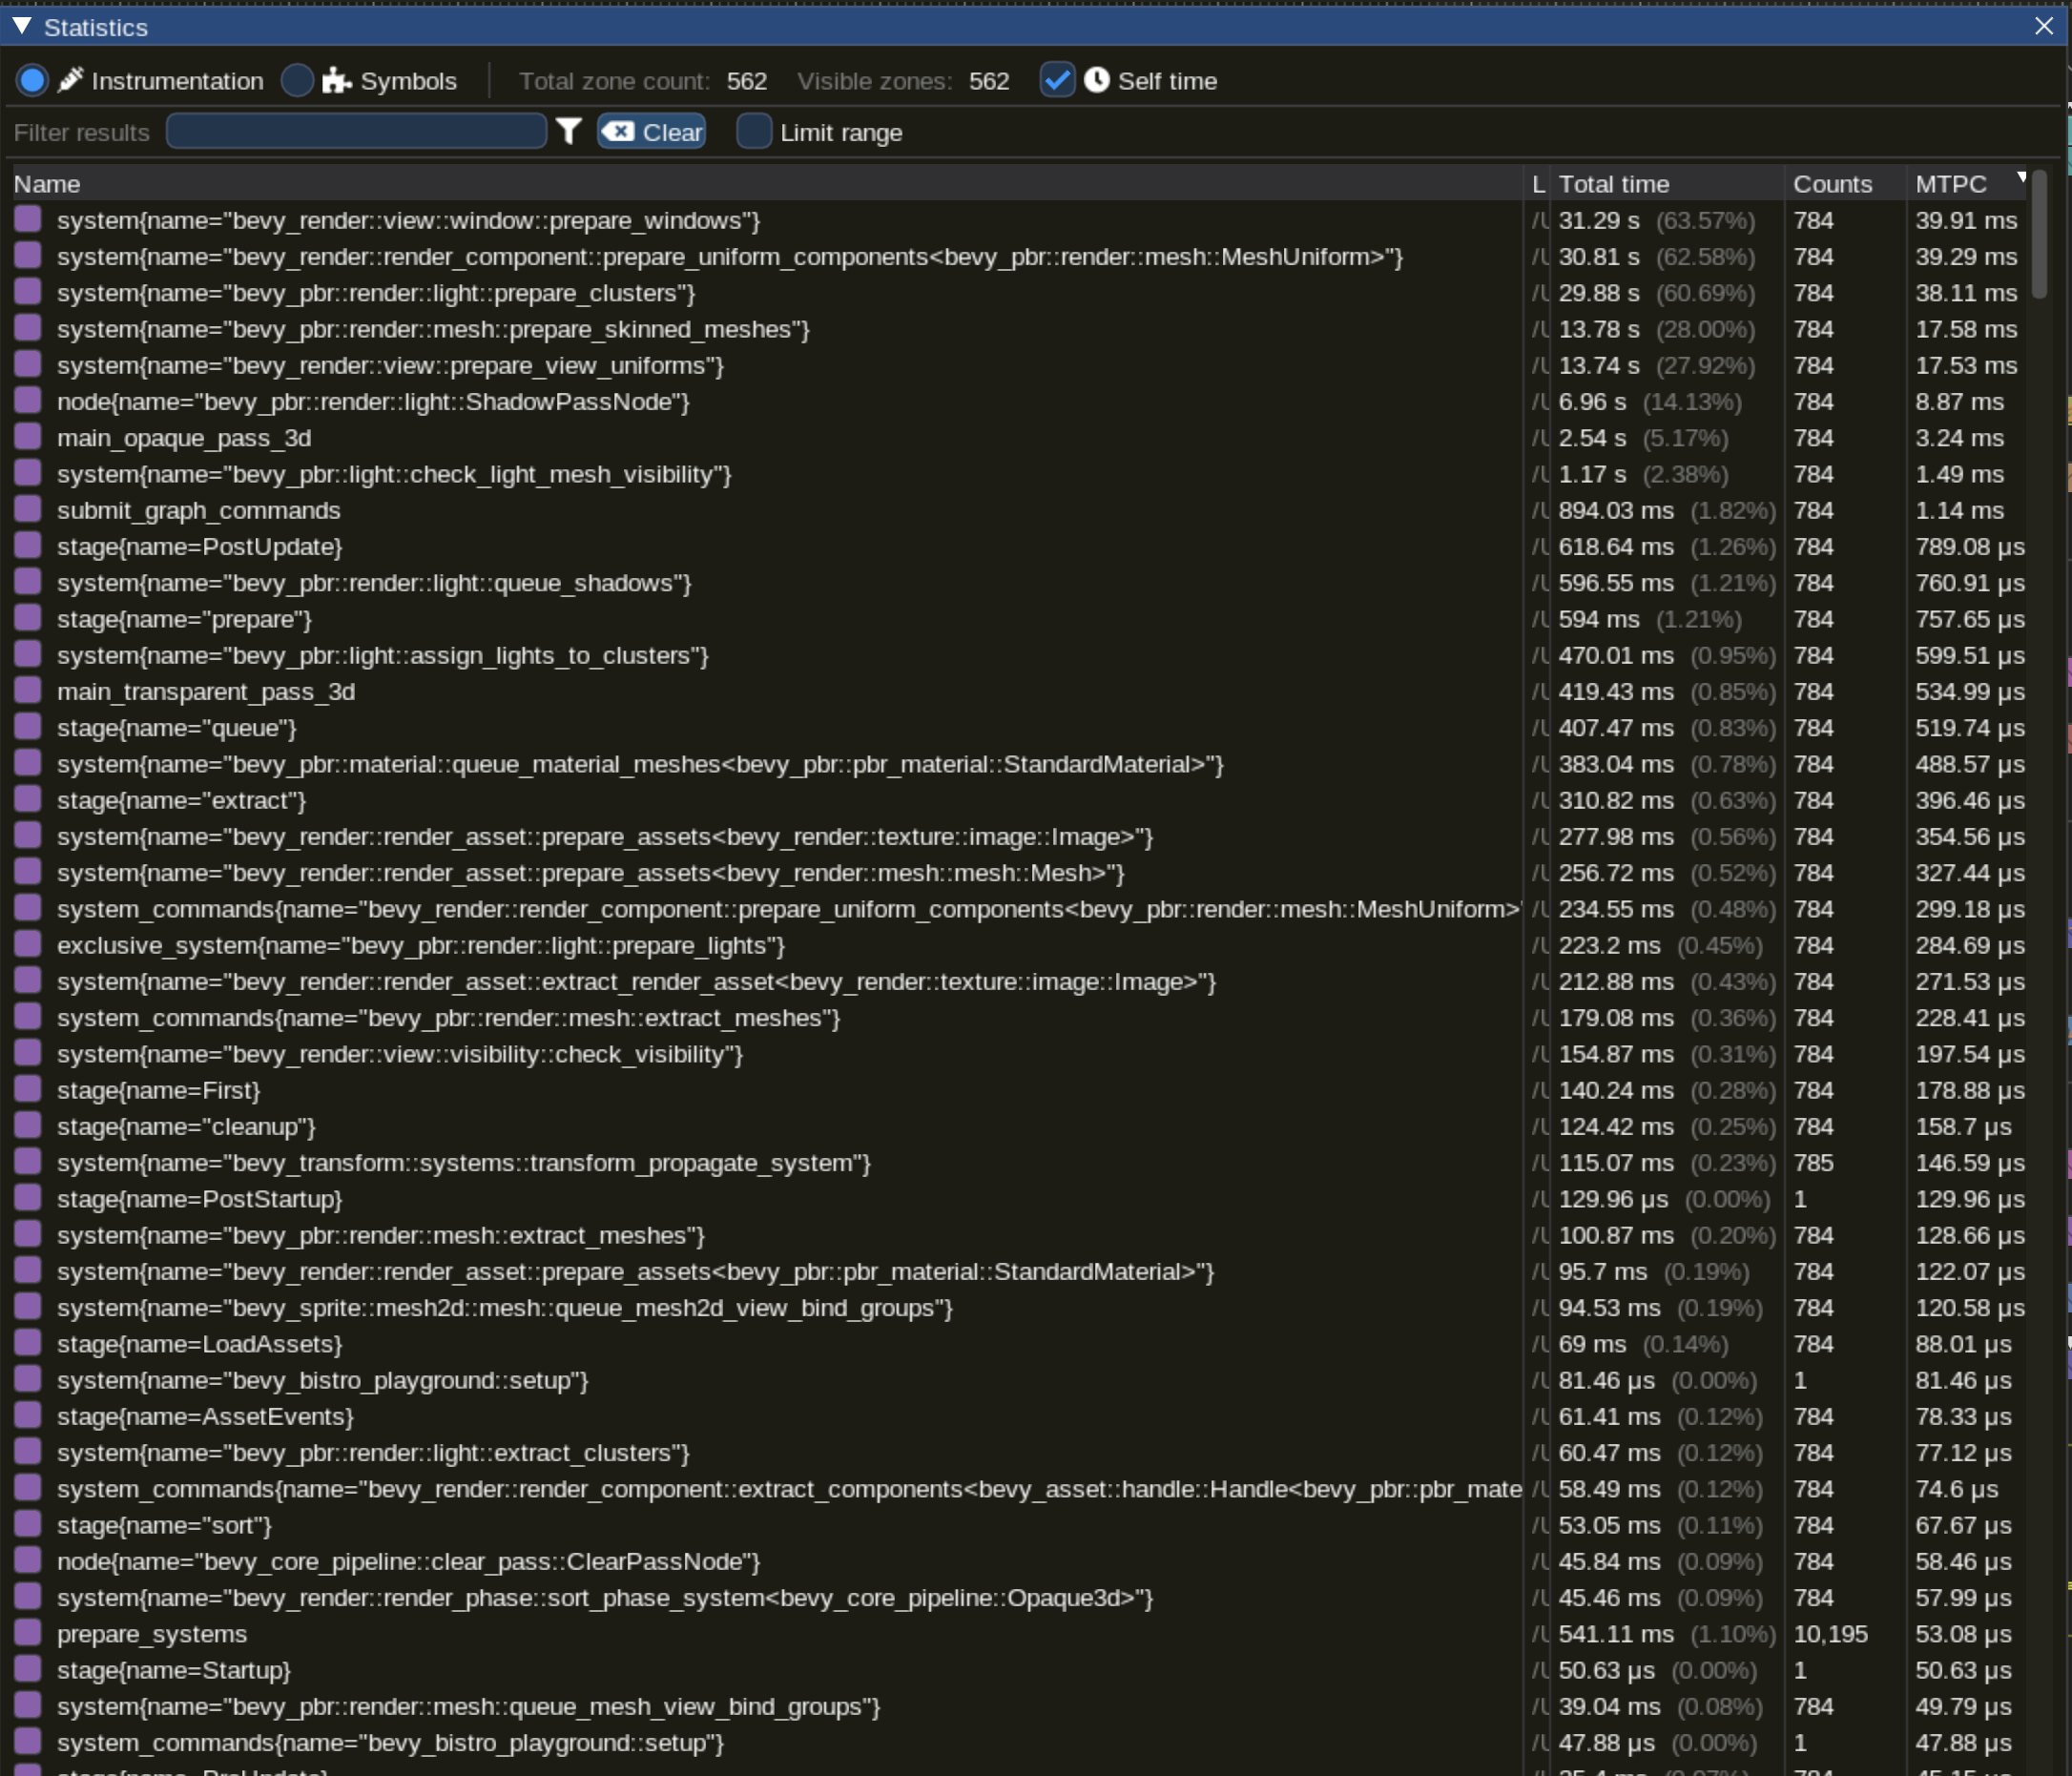
There is a button to display statistics of mean time per call (MTPC) for all systems:
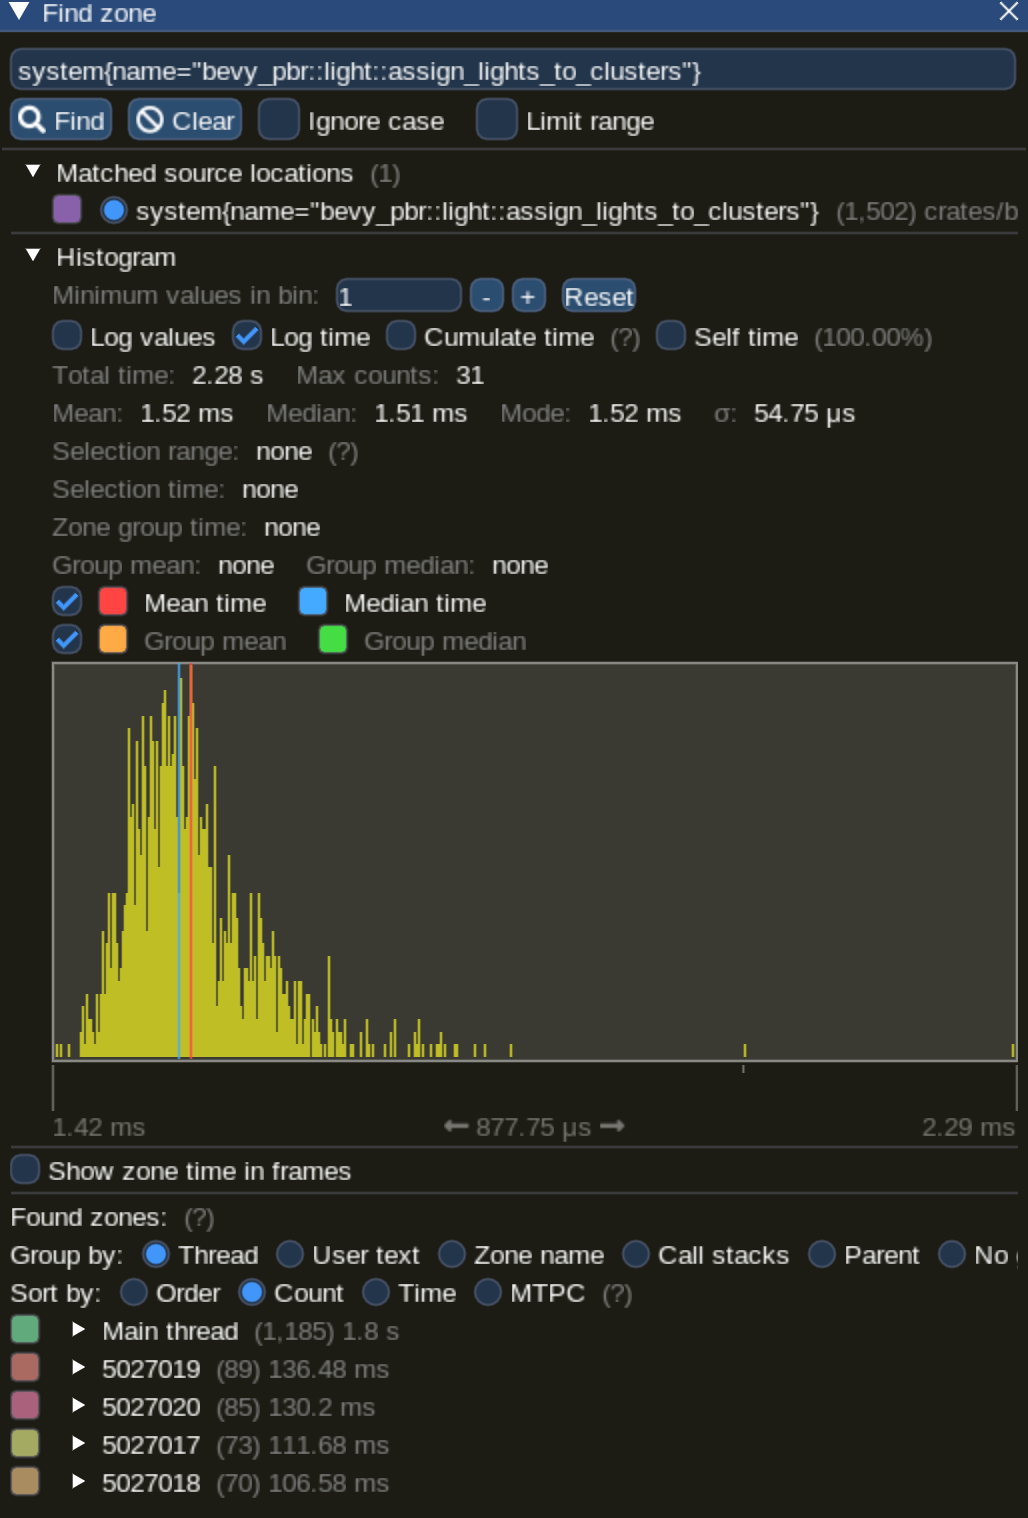
Or you can select an individual system and inspect its statistics (available through the "statistics" button in the top menu) to see things like the distribution of execution times in a graph, or statistical aggregates such as mean, median, standard deviation, etc. It will look something like this:
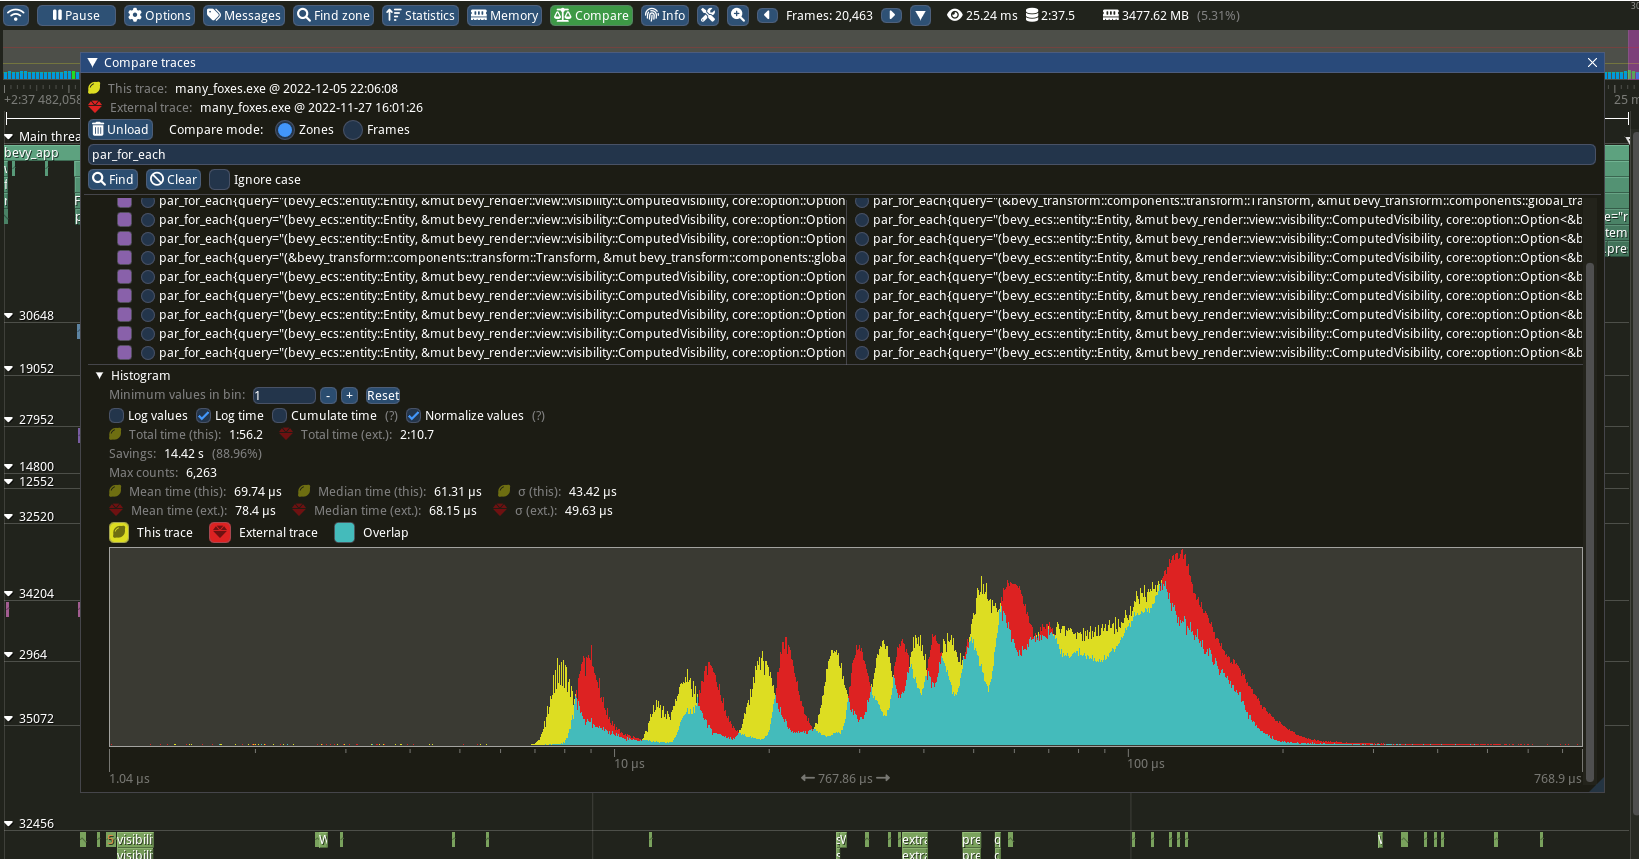
If you save more than one trace, you can compare the spans between both of them by clicking the Compare button at the top of the UI. This will open a dialog box asking to load a second trace. From there, it's possible to select any family of spans to more closely compare the timing and distribution of a particular span.
Adding your own spans
Add spans to your app like this (these are in bevy::prelude::* and bevy::log::*, just like the normal logging macros).
{
  // creates a span and starts the timer
  let my_span = info_span!("span_name", name = "span_name").entered();
  do_something_here();
} // my_span is dropped here ... this stops the timer


// You can also "manually" enter the span if you need more control over when the timer starts
// Prefer the previous, simpler syntax unless you need the extra control.
let my_span = info_span!("span_name", name = "span_name");
{
  // starts the span's timer
  let guard = my_span.enter();
  do_something_here();
} // guard is dropped here ... this stops the timer
Search for info_span! in this repo for some real-world examples.
For more details, check out the tracing span docs.
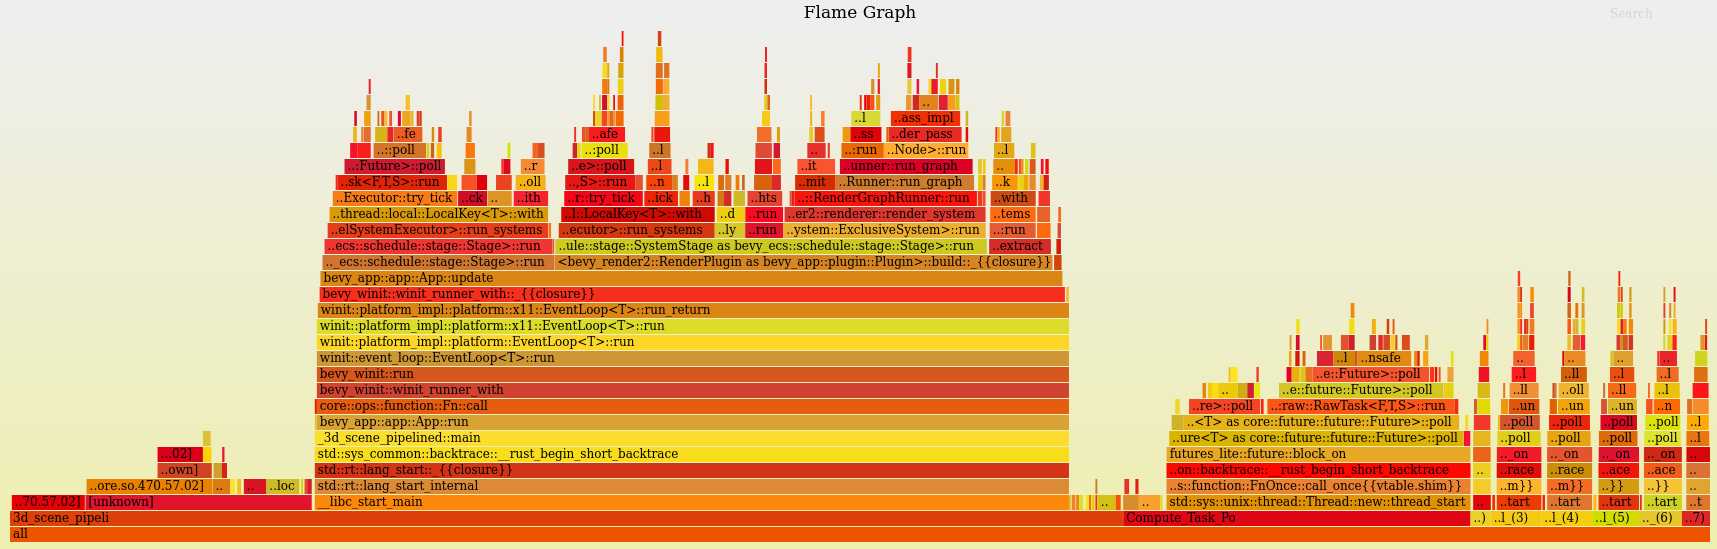
perf Flame Graph
This approach requires no extra instrumentation and shows finer-grained flame graphs of actual code call trees. This is useful when you want to identify the specific function of a "hot spot". The downside is that it has higher overhead, so your app will run slower than it normally does.
Install cargo-flamegraph, enable debug symbols in your release build, then run your app using one of the following commands. Note that cargo-flamegraph forwards arguments to cargo. You should treat the cargo-flamegraph command as a replacement for cargo run --release. The commands below include --example EXAMPLE_NAME to illustrate, but you can remove those arguments in favor of whatever you use to run your app:
- Graph-Like Flame Graph:
RUSTFLAGS='-C force-frame-pointers=y' cargo flamegraph -c "record -g" --example EXAMPLE_NAME - Flat-ish Flame Graph:
RUSTFLAGS='-C force-frame-pointers=y' cargo flamegraph --example EXAMPLE_NAME
After closing your app, an interactive svg file will be produced:
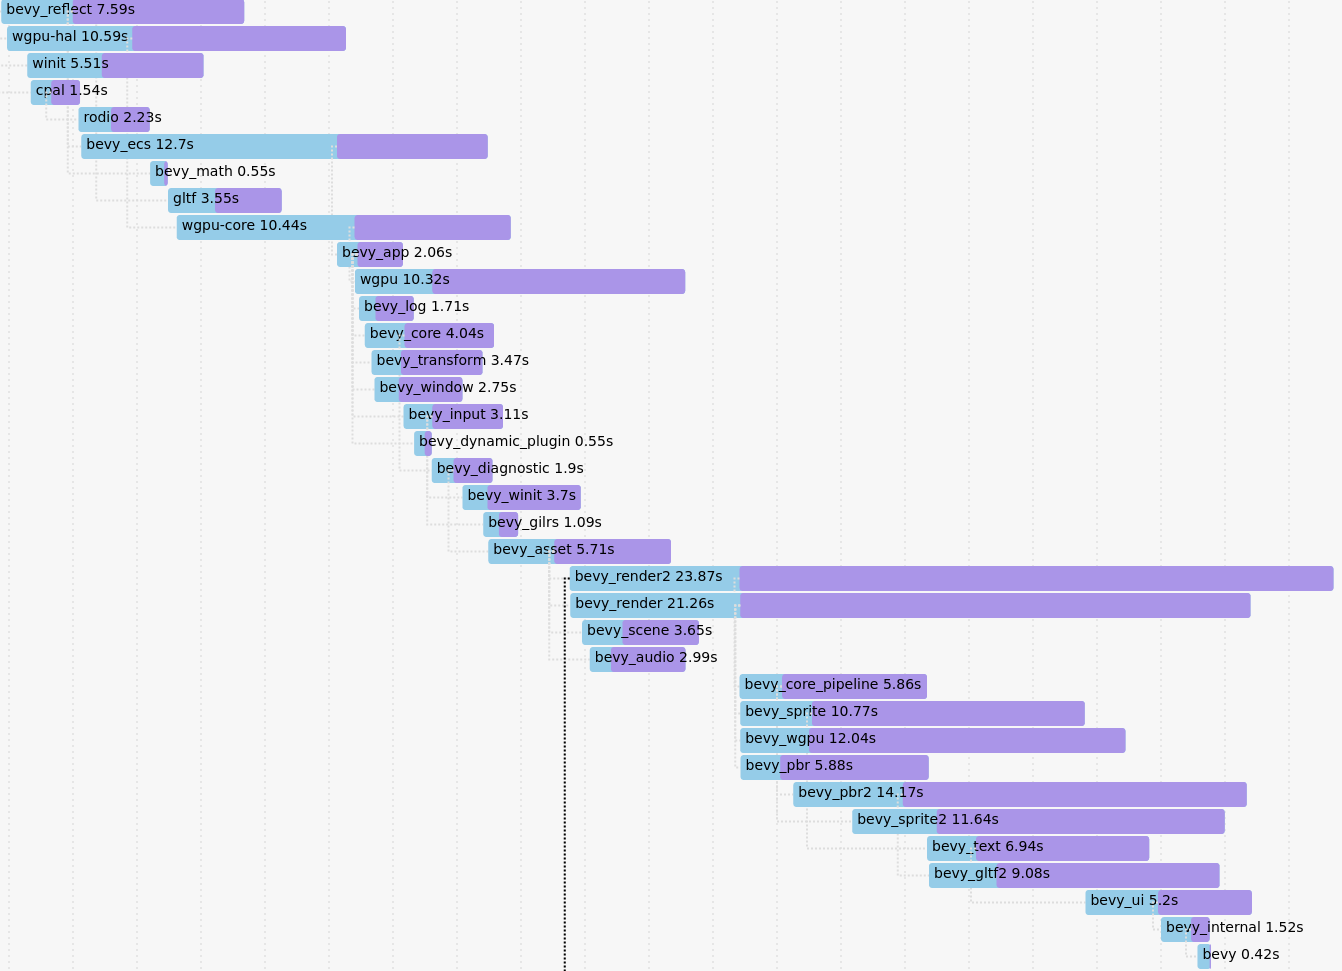
Compile time
Append --timings to your app's cargo command (ex: cargo build --timings).
If you want a "full" profile, make sure you run cargo clean first (note: this will clear previously generated reports).
The command will tell you where it saved the report, which will be in your target directory under cargo-timings/.
The report is a .html file and can be opened and viewed in your browser.
This will show how much time each crate in your app's dependency tree took to build.