# Get started with the Dev Board {#dev_board_get_started}
The Wi-Fi Developer Board serves as a tool to debug the Flipper Zero firmware. To debug the firmware, the initial step involves compiling the firmware from its source code. This process enables the debugging functionality within the firmware and generates all the necessary files required for debugging purposes.
Update the firmware of your Developer Board before using it. For more information, visit [Firmware update on Developer Board](https://docs.flipperzero.one/development/hardware/wifi-debugger-module/update).
On MacOS, install the **Xcode Command Line Tools** package, which includes Git as one of the pre-installed command-line utilities, by running in the Terminal the following command:
Then, run the **Flipper Build Tool** (FBT) to build the firmware:
```text
./fbt
```
***
## Connecting the Developer Board
The Developer Board can work in the **Wired** mode and two **Wireless** modes: **Wi-Fi access point (AP)** mode and **Wi-Fi client (STA)** mode. The Wired mode is the simplest to set up, but requires a USB Type-C cable. The Wireless modes are more complex to set up, but they allow you to debug your Flipper Zero wirelessly.
> **NOTE:** If the Developer Board doesn't appear in the list of devices, try using a different cable, USB port, or computer.
>
> **NOTE:** Flipper Zero logs can only be viewed when the Developer Board is connected via USB. The option to view logs over Wi-Fi will be added in future updates. For more information, visit [Reading logs via the Dev Board](https://docs.flipperzero.one/development/hardware/wifi-debugger-module/reading-logs).
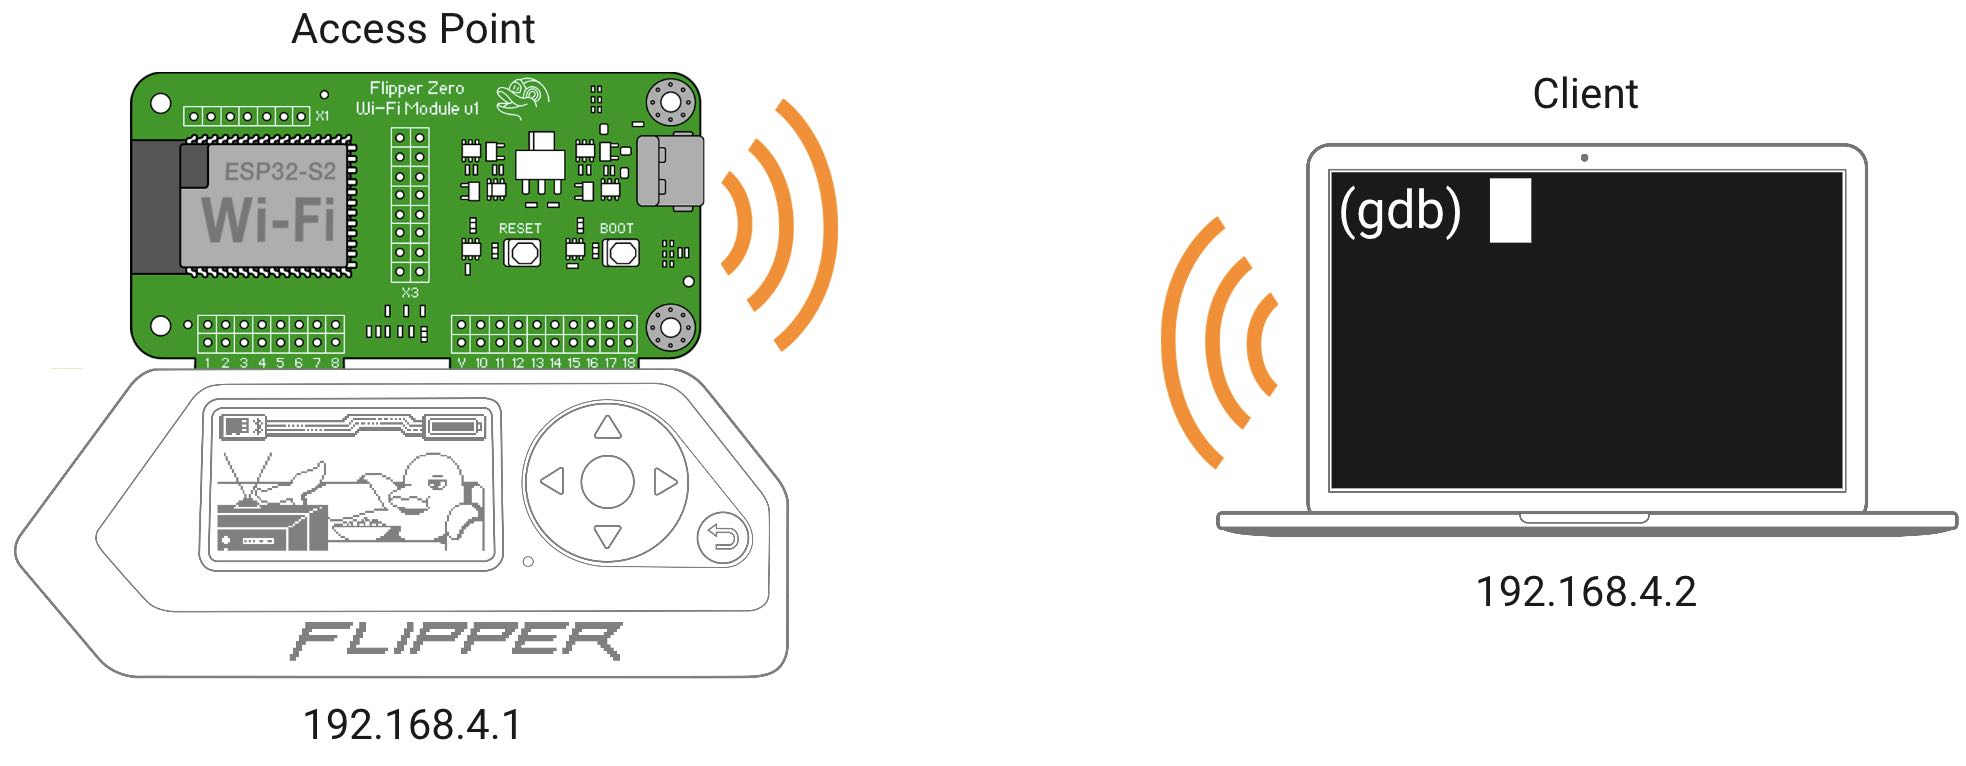
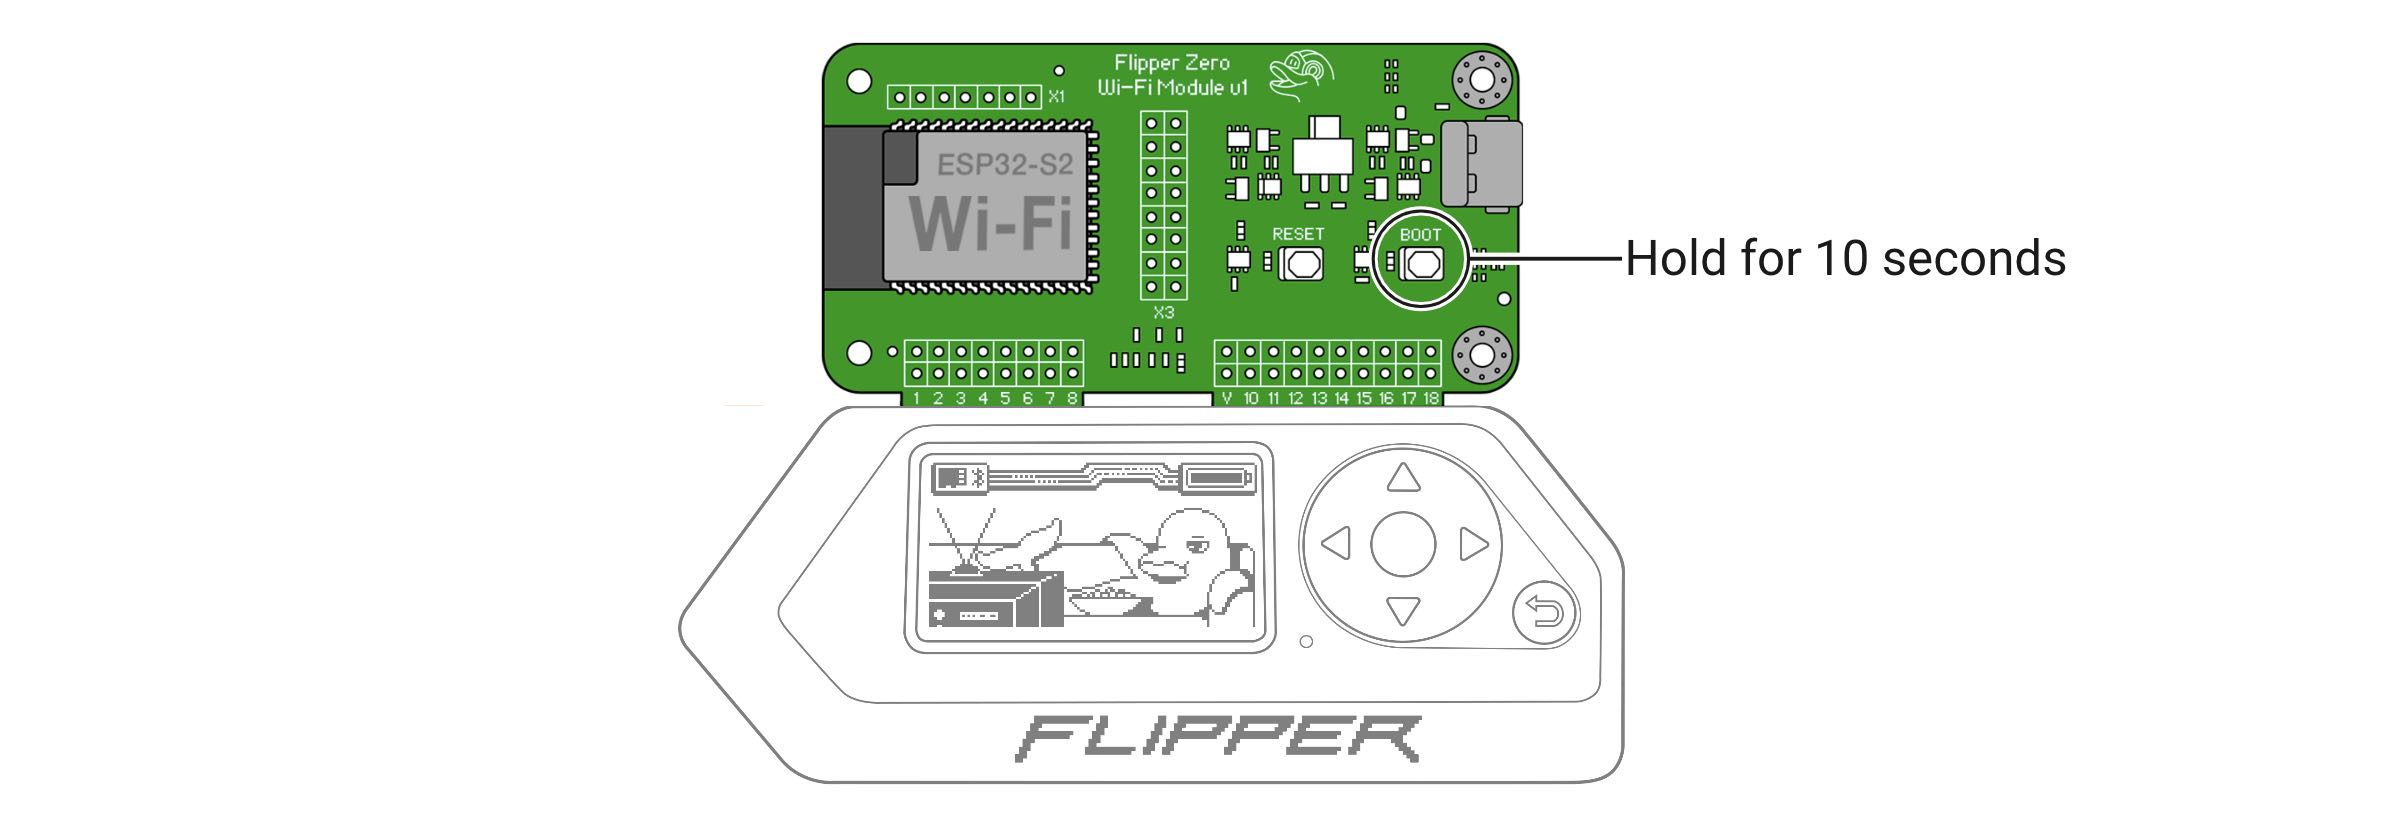
Out of the box, the Developer Board is configured to work as a **Wi-Fi access point**. This means it'll create its own Wi-Fi network to which you can connect. If your Developer Board doesn't create a Wi-Fi network, it is probably configured to work in **Wi-Fi client** mode. To reset your Developer Board back to **Wi-Fi access point** mode, press and hold the **BOOT** button for 10 seconds, then wait for the module to reboot.
To connect the Developer Board in **Wi-Fi access point** mode, do the following:
1. Cold-plug the Developer Board by turning off your Flipper Zero and connecting the Developer Board, and then turning it back on.
2. Open Wi-Fi settings on your client device (phone, laptop, or other).
4. Select the **STA** mode and enter your network's **SSID** (name) and **password**. For convenience, you can click the **+** button to see the list of nearby networks.
5. Save the configuration and reboot the Developer Board.
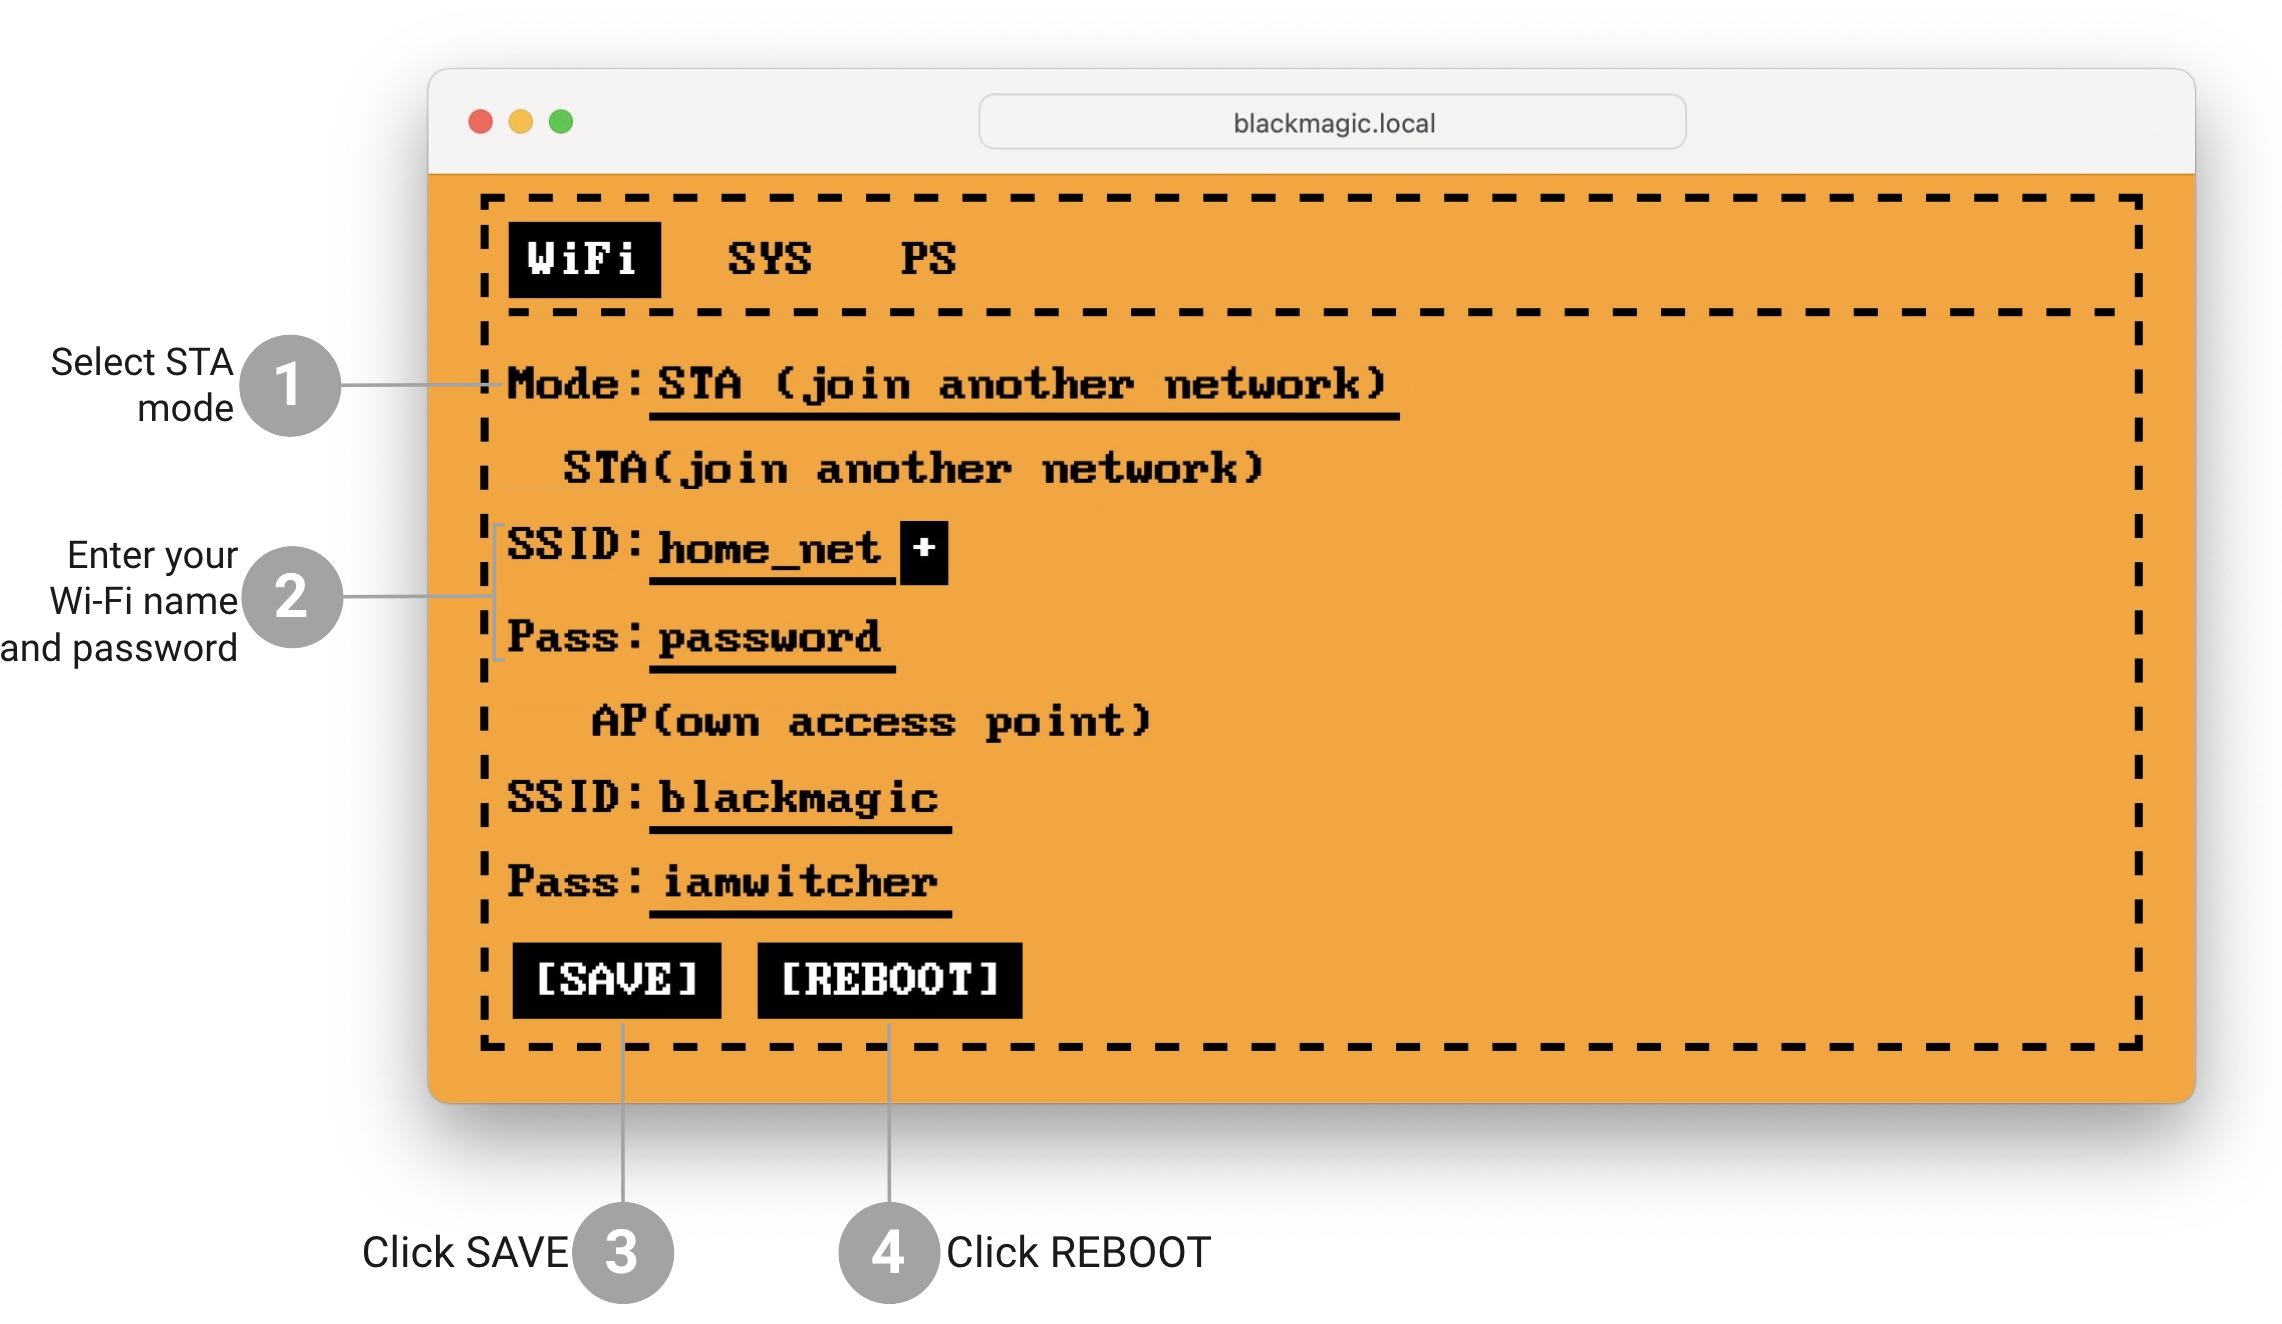
After rebooting, the Developer Board connects to your Wi-Fi network. You can connect to the device using the mDNS name **blackmagic.local** or the IP address it got from your router (you'll have to figure this out yourself, every router is different).
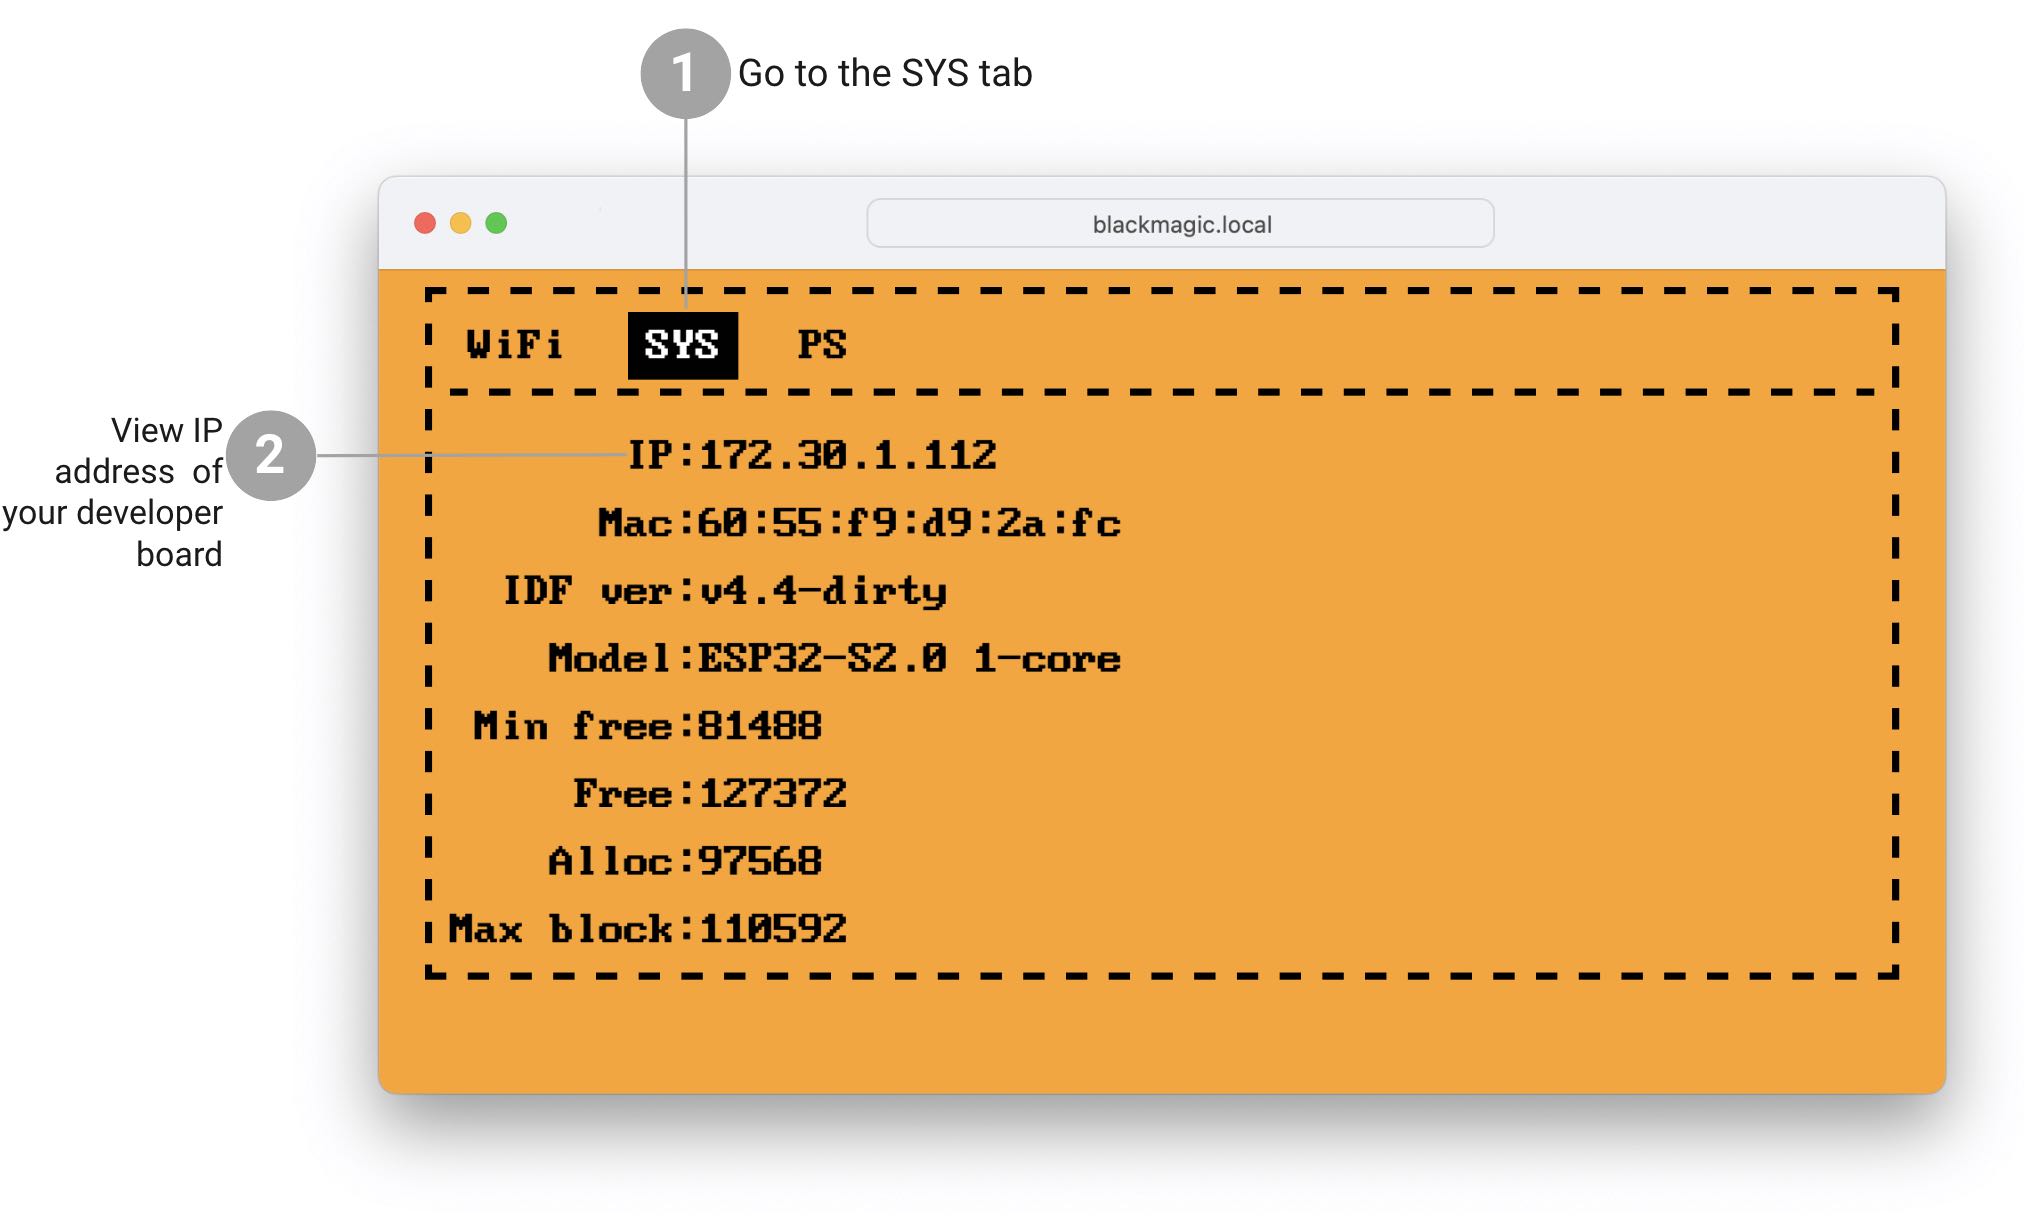
After connecting to your debugger via <http://blackmagic.local>, you can find its IP address in the **SYS** tab. You can also change the debugger's mode to **AP** or **STA** there.
***
## Debugging the firmware
Open the **Terminal** in the **flipperzero-firmware** directory that you cloned earlier and run the following command:
This will upload the firmware you've just built to your Flipper Zero via the Developer Board. After that, you can start debugging the firmware using the [GDB](https://www.gnu.org/software/gdb/) debugger. We recommend using **VSCode** with the recommended extensions, and we have pre-made configurations for it.
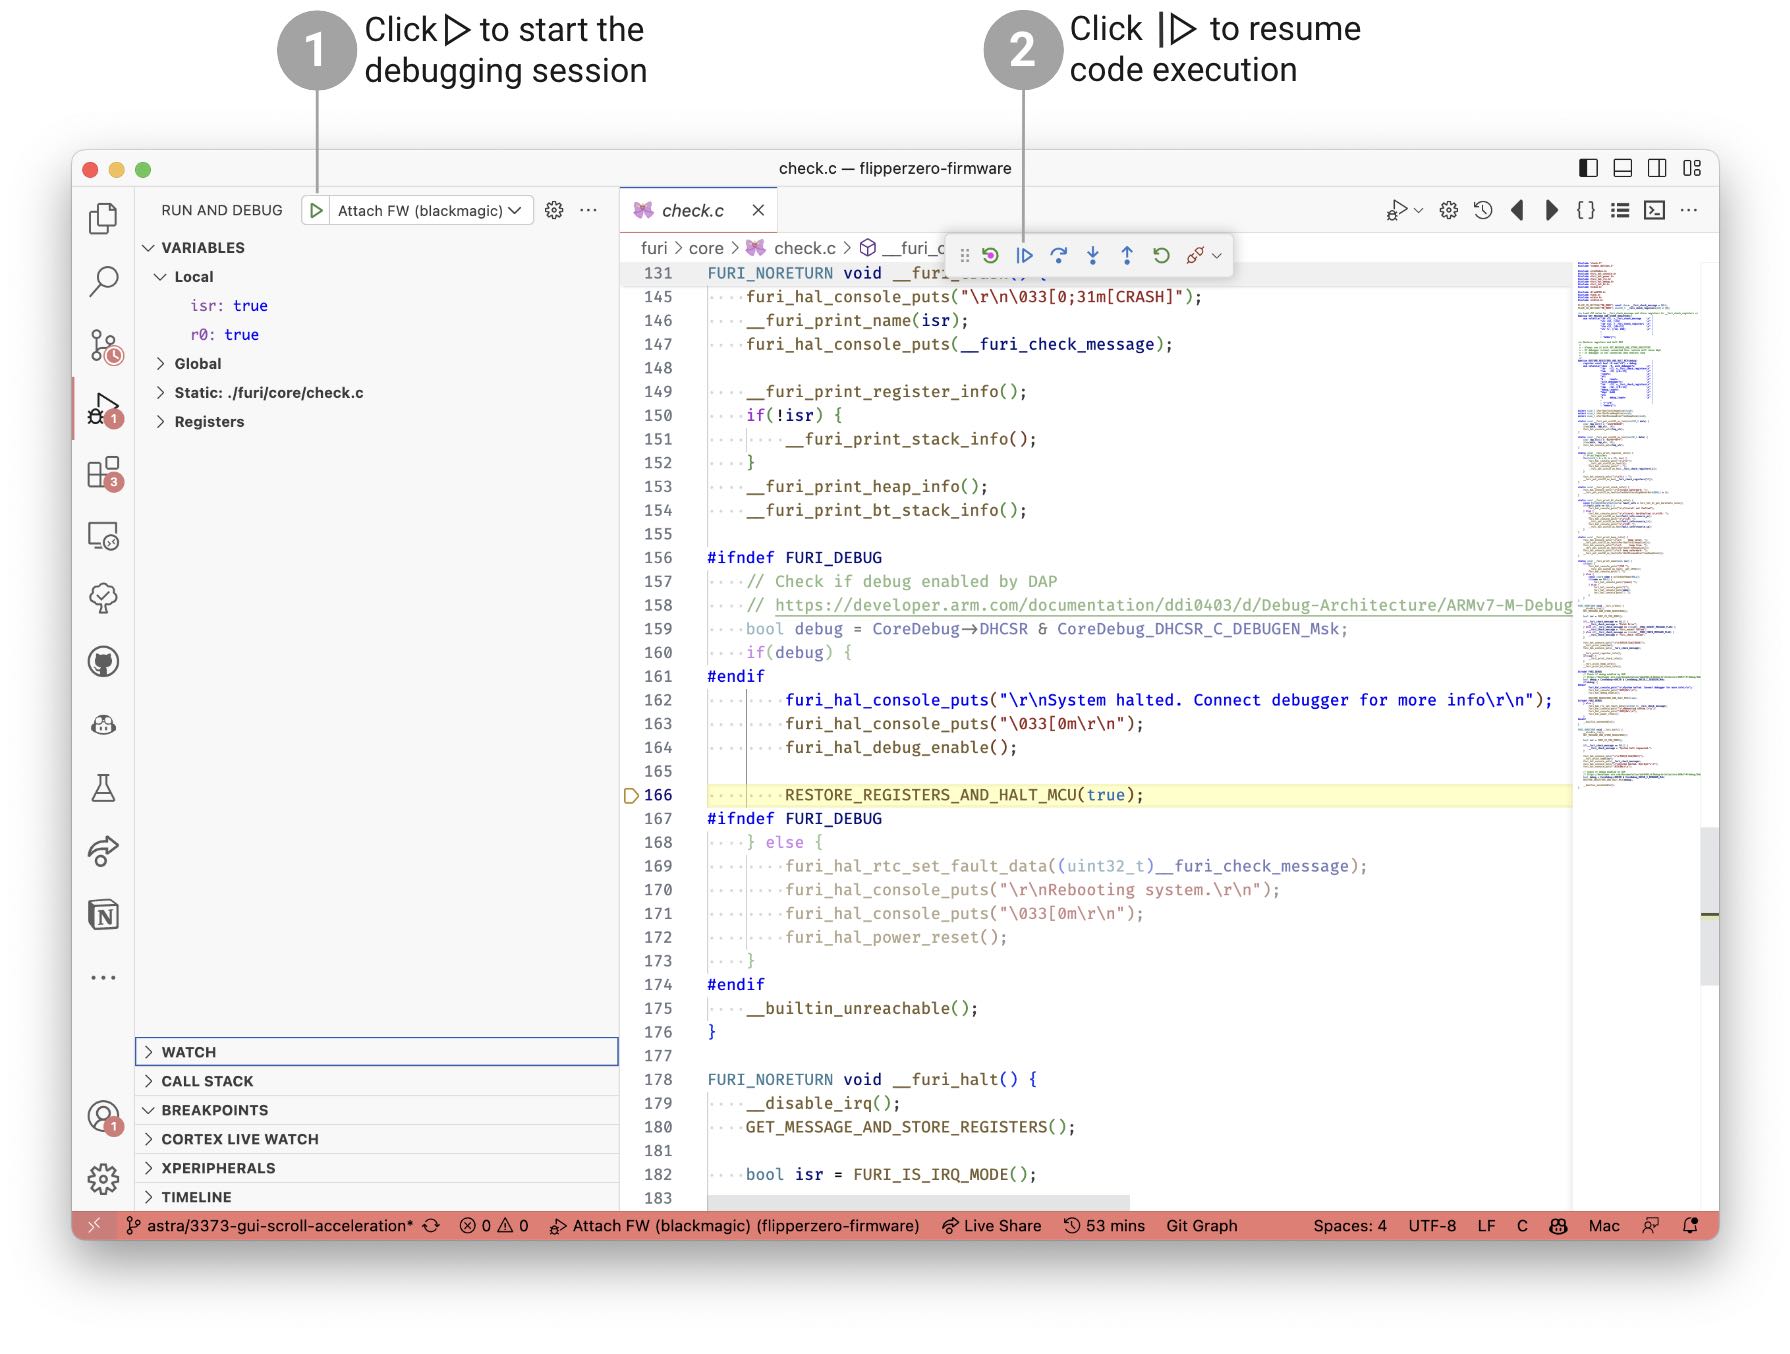
5. If needed, flash your Flipper Zero with the `./fbt flash` command, then click the **Play** button in the debug sidebar to start the debugging session.
6. Note that starting a debug session halts the execution of the firmware, so you'll need to click the **Continue** button on the toolbar at the top of your VSCode window to continue execution.
To learn about debugging, visit the following pages:
* [Debugging with GDB](https://sourceware.org/gdb/current/onlinedocs/gdb.pdf)
* [Debugging in VS Code](https://code.visualstudio.com/docs/editor/debugging)