4.5 KiB
Inspecting and debugging Mac OS Sotware
Static Analysis
otool
otool -L /bin/ls #List dynamically linked libraries
otool -tv /bin/ps #Decompile application
SuspiciousPackage
****SuspiciousPackage is a tool useful to inspect .pkg files installers and see what is inside before installing it.
These installers have preinstall and postinstall bash scripts that malware authors usually abuse to persist the malware.
hdiutil
This tool allows to mount Apple disk images **.dmg** files to inspect them before running anything:
hdiutil attach ~/Downloads/Firefox\ 58.0.2.dmg
It will be mounted in /Volumes
Objective-C
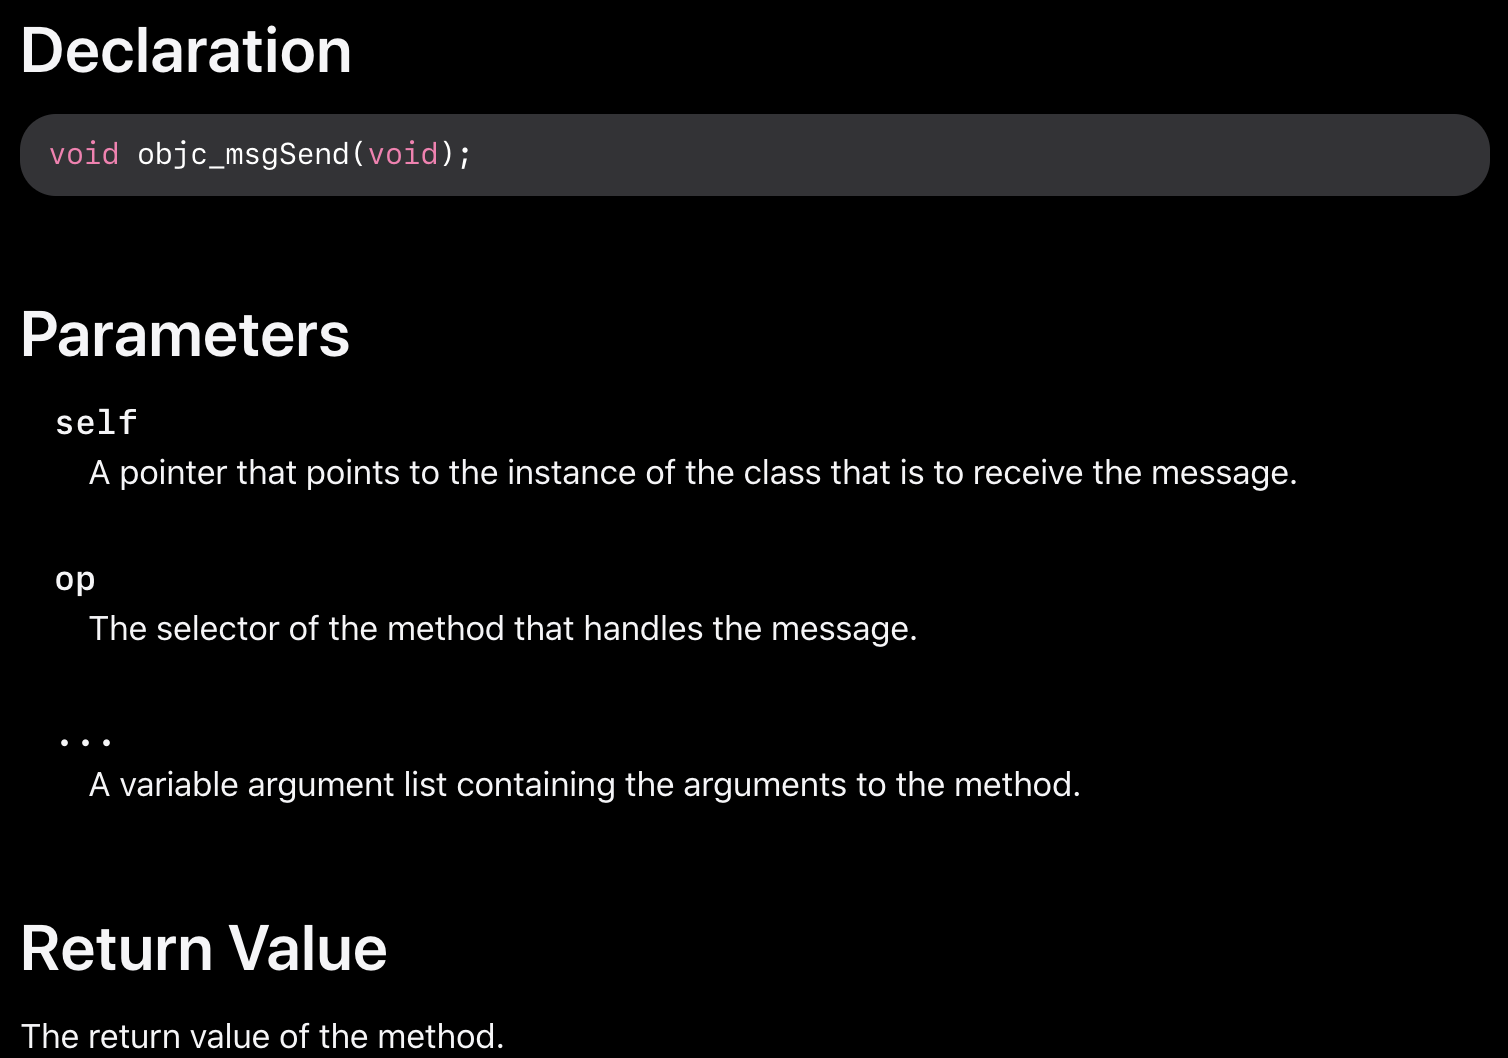
When a function is called in a binary that uses objective-C, the compiled code instead of calling that function, it will call objc_msgSend. Which will be calling the final function:
The params this function expects are:
- The first parameter
**self**is "a pointer that points to the instance of the class that is to receive the message". Or more simply put, it’s the object that the method is being invoked upon. If the method is a class method, this will be an instance of the class objectas a whole, whereas for an instance method, self will point to an instantiated instance of the class as an object. - The second parameter,
**op**, is "the selector of the method that handles the message". Again, more simply put, this is just the name of the method. - The remaining parameters are any values that are required by the method
op.
| Argument | Register | for objc_msgSend |
|---|---|---|
| 1st argument | rdi | self: object that the method is being invoked upon |
| 2nd argument | rsi | op: name of the method |
| 3rd argument | rdx | 1st argument to the method |
| 4th argument | rcx | 2nd argument to the method |
| 5th argument | r8 | 3rd argument to the method |
| 6th argument | r9 | 4th argument to the method |
| 7th+ argument | rsp+ (on the stack) | 5th+ argument to the method |
Dynamic Analysis
{% hint style="warning" %}
These tools require SIP to be disabled or to copy the binaries to a temporary folder and remove the signature with codesign --remove-signature <binary-path>
{% endhint %}
dtruss
dtruss -c ls #Get syscalls of ls
dtruss -c -p 1000 #get syscalls of PID 1000
ktrace
You can use this one even with SIP activated
ktrace trace -s -S -t c -c ls | grep "ls("
dtrace
It allows users access to applications at an extremely low level and provides a way for users to trace programs and even change their execution flow. Dtrace uses probes which are placed throughout the kernel and are at locations such as the beginning and end of system calls.
The available probes of dtrace can be obtained with:
dtrace -l | head
   ID   PROVIDER            MODULE                          FUNCTION NAME
    1     dtrace                                                     BEGIN
    2     dtrace                                                     END
    3     dtrace                                                     ERROR
   43    profile                                                     profile-97
   44    profile                                                     profile-199
The probe name consists of four parts: the provider, module, function, and name `fbt:mach_kernel:ptrace:entry`. If you not specifies some part of the name, Dtrace will apply that part as a wildcard.
A more detailed explanation and more examples can be found in https://illumos.org/books/dtrace/chp-intro.html
Examples
- In line
#Count the number of syscalls of each running process
sudo dtrace -n 'syscall:::entry {@[execname] = count()}'
- script
syscall:::entry
/pid == $1/
{
}

#Log every syscall of a PID
sudo dtrace -s script.d 1234
syscall::open:entry
{
    printf("%s(%s)", probefunc, copyinstr(arg0));
}
syscall::close:entry
{
        printf("%s(%d)\n", probefunc, arg0);
}

#Log files opened and closed by a process
sudo dtrace -s b.d -c "cat /etc/hosts"
syscall:::entry
{
        ;
}
syscall:::return
{
        printf("=%d\n", arg1);
}

#Log sys calls with values
sudo dtrace -s syscalls_info.d -c "cat /etc/hosts"
