Support HackTricks and get benefits!
- Do you work in a **cybersecurity company**? Do you want to see your **company advertised in HackTricks**? or do you want to have access to the **latest version of the PEASS or download HackTricks in PDF**? Check the [**SUBSCRIPTION PLANS**](https://github.com/sponsors/carlospolop)!
- Discover [**The PEASS Family**](https://opensea.io/collection/the-peass-family), our collection of exclusive [**NFTs**](https://opensea.io/collection/the-peass-family)
- Get the [**official PEASS & HackTricks swag**](https://peass.creator-spring.com)
- **Join the** [**💬**](https://emojipedia.org/speech-balloon/) [**Discord group**](https://discord.gg/hRep4RUj7f) or the [**telegram group**](https://t.me/peass) or **follow** me on **Twitter** [**🐦**](https://github.com/carlospolop/hacktricks/tree/7af18b62b3bdc423e11444677a6a73d4043511e9/\[https:/emojipedia.org/bird/README.md)[**@carlospolopm**](https://twitter.com/carlospolopm)**.**
- **Share your hacking tricks by submitting PRs to the** [**hacktricks github repo**](https://github.com/carlospolop/hacktricks)**.**
# Wasm decompiler / Wat compiler
Online:
* Use [https://webassembly.github.io/wabt/demo/wasm2wat/index.html](https://webassembly.github.io/wabt/demo/wasm2wat/index.html) to **decompile** from wasm \(binary\) to wat \(clear text\)
* Use [https://webassembly.github.io/wabt/demo/wat2wasm/](https://webassembly.github.io/wabt/demo/wat2wasm/) to **compile** from wat to wasm
* you can also try to use [https://wwwg.github.io/web-wasmdec/](https://wwwg.github.io/web-wasmdec/) to decompile
Software:
* [https://www.pnfsoftware.com/jeb/demo](https://www.pnfsoftware.com/jeb/demo)
* [https://github.com/wwwg/wasmdec](https://github.com/wwwg/wasmdec)
# .Net decompiler
[https://github.com/icsharpcode/ILSpy](https://github.com/icsharpcode/ILSpy)
[ILSpy plugin for Visual Studio Code](https://github.com/icsharpcode/ilspy-vscode): You can have it in any OS \(you can install it directly from VSCode, no need to download the git. Click on **Extensions** and **search ILSpy**\).
If you need to **decompile**, **modify** and **recompile** again you can use: [**https://github.com/0xd4d/dnSpy/releases**](https://github.com/0xd4d/dnSpy/releases) \(**Right Click -> Modify Method** to change something inside a function\).
You cloud also try [https://www.jetbrains.com/es-es/decompiler/](https://www.jetbrains.com/es-es/decompiler/)
## DNSpy Logging
In order to make **DNSpy log some information in a file**, you could use this .Net lines:
```bash
using System.IO;
path = "C:\\inetpub\\temp\\MyTest2.txt";
File.AppendAllText(path, "Password: " + password + "\n");
```
## DNSpy Debugging
In order to debug code using DNSpy you need to:
First, change the **Assembly attributes** related to **debugging**:

From:
```aspnet
[assembly: Debuggable(DebuggableAttribute.DebuggingModes.IgnoreSymbolStoreSequencePoints)]
```
To:
```text
[assembly: Debuggable(DebuggableAttribute.DebuggingModes.Default |
DebuggableAttribute.DebuggingModes.DisableOptimizations |
DebuggableAttribute.DebuggingModes.IgnoreSymbolStoreSequencePoints |
DebuggableAttribute.DebuggingModes.EnableEditAndContinue)]
```
And click on **compile**:

Then save the new file on _**File >> Save module...**_:
This is necessary because if you don't do this, at **runtime** several **optimisations** will be applied to the code and it could be possible that while debugging a **break-point is never hit** or some **variables don't exist**.
Then, if your .Net application is being **run** by **IIS** you can **restart** it with:
```text
iisreset /noforce
```
Then, in order to start debugging you should close all the opened files and inside the **Debug Tab** select **Attach to Process...**:

Then select **w3wp.exe** to attach to the **IIS server** and click **attach**:

Now that we are debugging the process, it's time to stop it and load all the modules. First click on _Debug >> Break All_ and then click on _**Debug >> Windows >> Modules**_:

Click any module on **Modules** and selec**t Open All Modules**:

Right click any module in **Assembly Explorer** and click **Sort Assemblies**:

# Java decompiler
[https://github.com/skylot/jadx](https://github.com/skylot/jadx)
[https://github.com/java-decompiler/jd-gui/releases](https://github.com/java-decompiler/jd-gui/releases)
# Debugging DLLs
## Using IDA
* **Load rundll32** \(64bits in C:\Windows\System32\rundll32.exe and 32 bits in C:\Windows\SysWOW64\rundll32.exe\)
* Select **Windbg** debugger
* Select "**Suspend on library load/unload**"

* Configure the **parameters** of the execution putting the **path to the DLL** and the function that you want to call:
Then, when you start debugging **the execution will be stopped when each DLL is loaded**, then, when rundll32 load your DLL the execution will be stopped.
But, how can you get to the code of the DLL that was lodaded? Using this method, I don't know how.
## Using x64dbg/x32dbg
* **Load rundll32** \(64bits in C:\Windows\System32\rundll32.exe and 32 bits in C:\Windows\SysWOW64\rundll32.exe\)
* **Change the Command Line** \( _File --> Change Command Line_ \) and set the path of the dll and the function that you want to call, for example: "C:\Windows\SysWOW64\rundll32.exe" "Z:\shared\Cybercamp\rev2\\14.ridii\_2.dll",DLLMain
* Change _Options --> Settings_ and select "**DLL Entry**".
* Then **start the execution**, the debugger will stop at each dll main, at some point you will **stop in the dll Entry of your dll**. From there, just search for the points where you want to put a breakpoint.
Notice that when the execution is stopped by any reason in win64dbg you can see **in which code you are** looking in the **top of the win64dbg window**:
Then, looking to this ca see when the execution was stopped in the dll you want to debug.
# ARM & MIPS
{% embed url="https://github.com/nongiach/arm\_now" %}
# Shellcodes
## Debugging a shellcode with blobrunner
[**Blobrunner**](https://github.com/OALabs/BlobRunner) will **allocate** the **shellcode** inside a space of memory, will **indicate** you the **memory address** were the shellcode was allocated and will **stop** the execution.
Then, you need to **attach a debugger** \(Ida or x64dbg\) to the process and put a **breakpoint the indicated memory address** and **resume** the execution. This way you will be debugging the shellcode.
The releases github page contains zips containing the compiled releases: [https://github.com/OALabs/BlobRunner/releases/tag/v0.0.5](https://github.com/OALabs/BlobRunner/releases/tag/v0.0.5)
You can find a slightly modified version of Blobrunner in the following link. In order to compile it just **create a C/C++ project in Visual Studio Code, copy and paste the code and build it**.
{% page-ref page="blobrunner.md" %}
## Debugging a shellcode with jmp2it
[**jmp2it** ](https://github.com/adamkramer/jmp2it/releases/tag/v1.4)is very similar to blobrunner. It will **allocate** the **shellcode** inside a space of memory, and start an **eternal loop**. You then need to **attach the debugger** to the process, **play start wait 2-5 secs and press stop** and you will find yourself inside the **eternal loop**. Jump to the next instruction of the eternal loop as it will be a call to the shellcode, and finally you will find yourself executing the shellcode.
You can download a compiled version of [jmp2it inside the releases page](https://github.com/adamkramer/jmp2it/releases/).
## Debugging shellcode using Cutter
[**Cutter**](https://github.com/rizinorg/cutter/releases/tag/v1.12.0) is the GUI of radare. Using cutter you can emulate the shellcode and inspect it dynamically.
Note that Cutter allows you to "Open File" and "Open Shellcode". In my case when I opened the shellcode as a file it decompiled it correctly, but when I opened it as a shellcode it didn't:

In order to start the emulation in the place you want to, set a bp there and apparently cutter will automatically start the emulation from there:
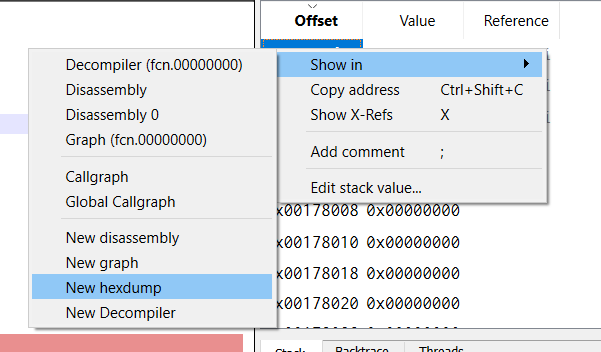

You can see the stack for example inside a hex dump:
## Deobfuscating shellcode and getting executed functions
You should try [**scdbg**](http://sandsprite.com/blogs/index.php?uid=7&pid=152).
It will tell you things like **which functions** is the shellcode using and if the shellcode is **decoding** itself in memory.
```bash
scdbg.exe -f shellcode # Get info
scdbg.exe -f shellcode -r #show analysis report at end of run
scdbg.exe -f shellcode -i -r #enable interactive hooks (file and network) and show analysis report at end of run
scdbg.exe -f shellcode -d #Dump decoded shellcode
scdbg.exe -f shellcode /findsc #Find offset where starts
scdbg.exe -f shellcode /foff 0x0000004D #Start the executing in that offset
```
scDbg also counts with a graphical launcher where you can select the options you want and execute the shellcode
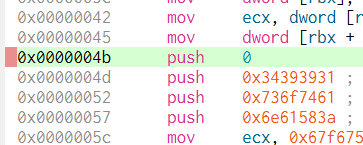
The **Create Dump** option will dump the final shellcode if any change is done to the shellcode dynamically in memory \(useful to download the decoded shellcode\). The **start offset** can be useful to start the shellcode at a specific offset. The **Debug Shell** option is useful to debug the shellcode using the scDbg terminal \(however I find any of the options explained before better for this matter as you will be able to use Ida or x64dbg\).
## Disassembling using CyberChef
Upload you shellcode file as input and use the following receipt to decompile it: [https://gchq.github.io/CyberChef/\#recipe=To\_Hex\('Space',0\)Disassemble\_x86\('32','Full%20x86%20architecture',16,0,true,true\)](https://gchq.github.io/CyberChef/#recipe=To_Hex%28'Space',0%29Disassemble_x86%28'32','Full%20x86%20architecture',16,0,true,true%29)
# [Movfuscator](https://github.com/xoreaxeaxeax/movfuscator)
This ofuscator change all the instructions for `mov`\(yeah, really cool\). It also uses interruptions to change executions flows. For more information about how does it works:
* [https://www.youtube.com/watch?v=2VF\_wPkiBJY](https://www.youtube.com/watch?v=2VF_wPkiBJY)
* [https://github.com/xoreaxeaxeax/movfuscator/blob/master/slides/domas\_2015\_the\_movfuscator.pdf](https://github.com/xoreaxeaxeax/movfuscator/blob/master/slides/domas_2015_the_movfuscator.pdf)
If you are lucky [demovfuscator ](https://github.com/kirschju/demovfuscator)will deofuscate the binary. It has several dependencies
```text
apt-get install libcapstone-dev
apt-get install libz3-dev
```
And [install keystone](https://github.com/keystone-engine/keystone/blob/master/docs/COMPILE-NIX.md) \(`apt-get install cmake; mkdir build; cd build; ../make-share.sh; make install`\)
If you are playing a **CTF, this workaround to find the flag** could be very useful: [https://dustri.org/b/defeating-the-recons-movfuscator-crackme.html](https://dustri.org/b/defeating-the-recons-movfuscator-crackme.html)
# Delphi
For Delphi compiled binaries you can use [https://github.com/crypto2011/IDR](https://github.com/crypto2011/IDR)
# Courses
* [https://github.com/0xZ0F/Z0FCourse\_ReverseEngineering](https://github.com/0xZ0F/Z0FCourse_ReverseEngineering)
* [https://github.com/malrev/ABD](https://github.com/malrev/ABD) \(Binary deobfuscation\)
Support HackTricks and get benefits!
- Do you work in a **cybersecurity company**? Do you want to see your **company advertised in HackTricks**? or do you want to have access to the **latest version of the PEASS or download HackTricks in PDF**? Check the [**SUBSCRIPTION PLANS**](https://github.com/sponsors/carlospolop)!
- Discover [**The PEASS Family**](https://opensea.io/collection/the-peass-family), our collection of exclusive [**NFTs**](https://opensea.io/collection/the-peass-family)
- Get the [**official PEASS & HackTricks swag**](https://peass.creator-spring.com)
- **Join the** [**💬**](https://emojipedia.org/speech-balloon/) [**Discord group**](https://discord.gg/hRep4RUj7f) or the [**telegram group**](https://t.me/peass) or **follow** me on **Twitter** [**🐦**](https://github.com/carlospolop/hacktricks/tree/7af18b62b3bdc423e11444677a6a73d4043511e9/\[https:/emojipedia.org/bird/README.md)[**@carlospolopm**](https://twitter.com/carlospolopm)**.**
- **Share your hacking tricks by submitting PRs to the** [**hacktricks github repo**](https://github.com/carlospolop/hacktricks)**.**