| .github/ISSUE_TEMPLATE | ||
| assets | ||
| src | ||
| tests | ||
| .gitignore | ||
| .markdownlint.json | ||
| .travis.yml | ||
| Cargo.toml | ||
| LICENSE | ||
| README.md | ||
| rustfmt.toml | ||
bottom
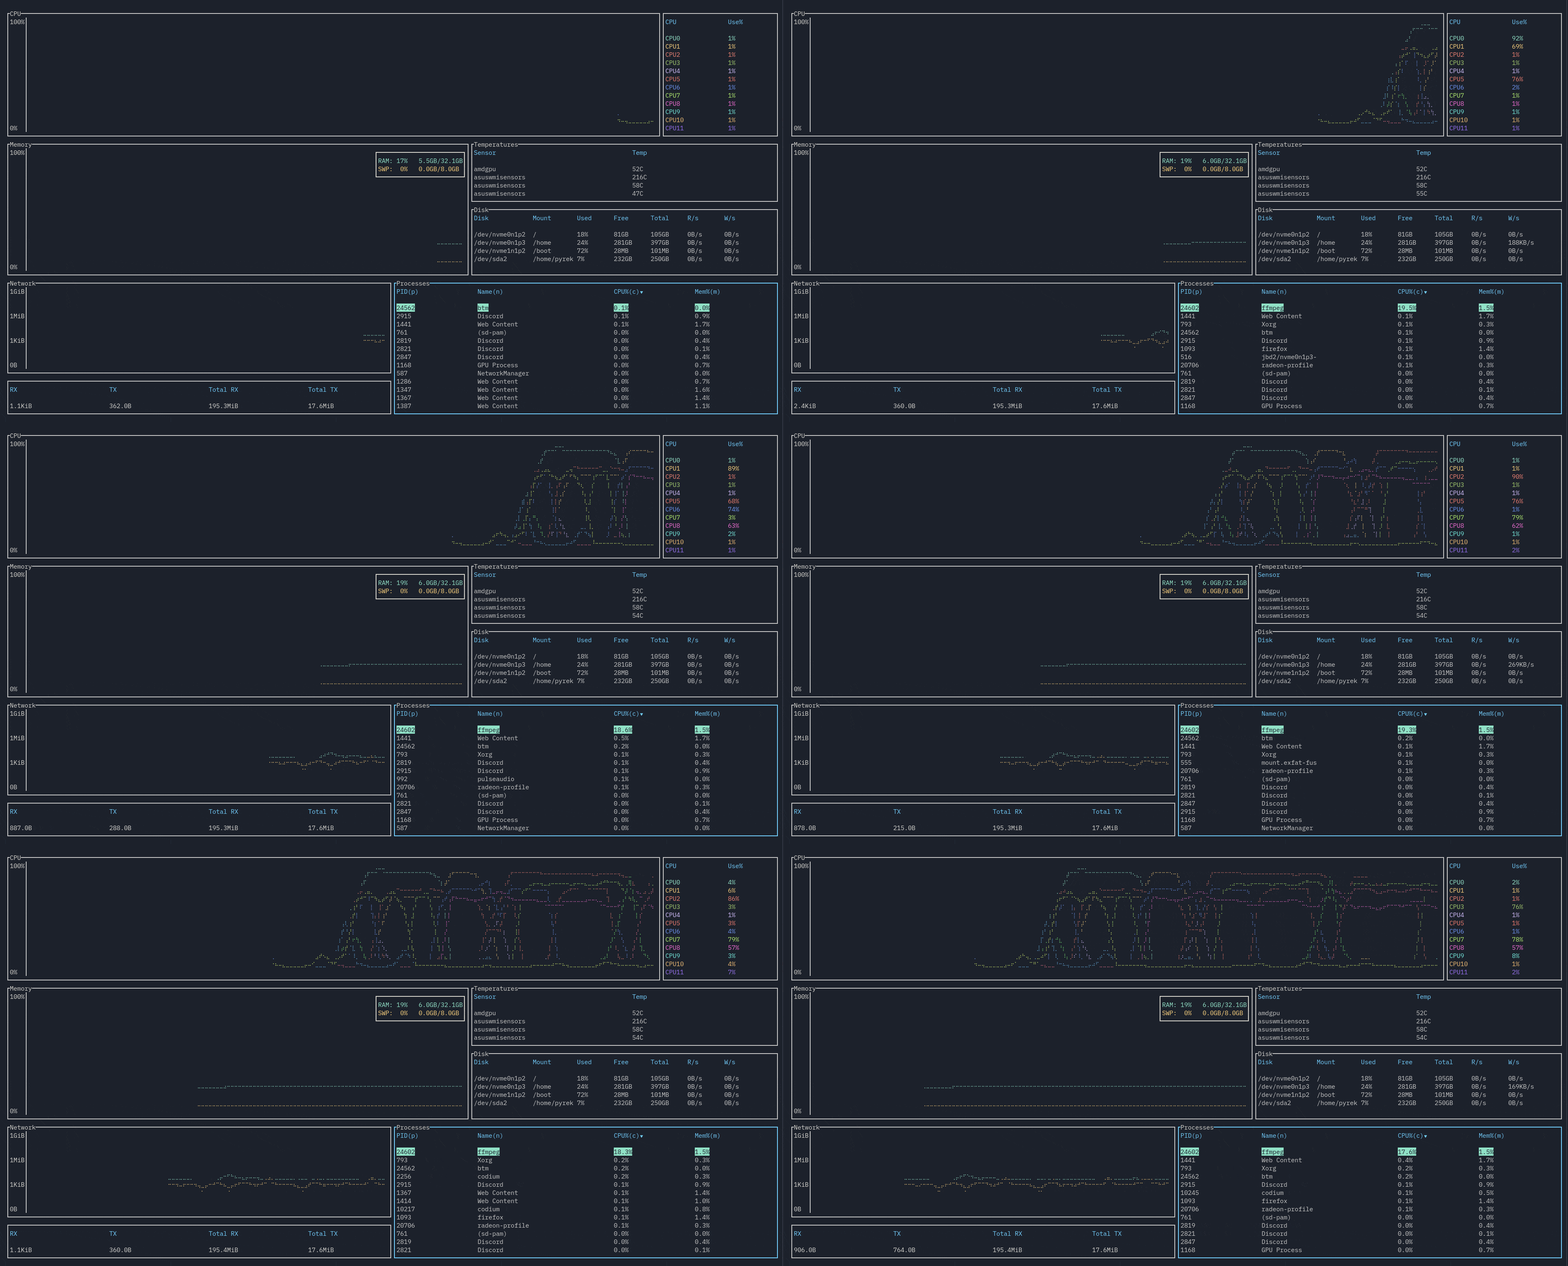
A graphical top clone, written in Rust. Inspired by both gtop and gotop
Features
Features of bottom include:
-
CPU widget to show a visual representation of per-core usage. Average CPU display also exists.
-
Memory widget to show a visual representation of both RAM and SWAP usage.
-
Networks widget to show a log-based visual representation of network usage.
-
Sortable and searchable process widget. Searching supports regex, and you can search by PID and process name.
-
Disks widget to display usage and I/O per second.
-
Temperature widget to monitor detected sensors in your system.
The compatibility of each widget and operating systems are, as of version 0.1.0, as follows:
| OS/Widget | CPU | Memory | Disks | Temperature | Processes | Networks |
|---|---|---|---|---|---|---|
| Linux | ✓ | ✓ | ✓ | ✓ | ✓ | ✓ |
| Windows | ✓ | ✓ | ✓ | Currently not working | ✓ | Partially supported (total RX/TX unavailable) |
| macOS | Untested | Untested | Untested | Untested | Untested | Untested |
Installation
Linux
You can install the in-development version by cloning and using cargo build --release. You can get release versions using cargo install bottom, or manually building from the Releases page. Other installation methods based on distros are as follows:
Arch Linux
You can get the release versions from the AUR by installing bottom.
Windows
You can install the in-development version by cloning and using cargo build --release. You can get release versions using cargo install bottom, or manually building from the Releases page. You may need to install a font like FreeMono and use a terminal like cmder for font support to work properly, unfortunately.
macOS
macOS support will hopefully come soonTM.
Usage
Run using btm.
Command line options
-
-h,--helpshows the help screen and exits. -
-a,--avgcpuenables also showing the average CPU usage in addition to per-core CPU usage. -
-m,--dot-markeruses a dot marker instead of the default braille marker. -
-c,--celsiusdisplays the temperature type in Celsius. This is the default. -
-f,--fahrenheitdisplays the temperature type in Fahrenheit. -
-k,--kelvindisplays the temperature type in Kelvin. -
-v,--versiondisplays the version number and exits. -
-d,--debugenables debug logging. -
-r <RATE>,--rate <RATE>will set the refresh rate in milliseconds. Lowest it can go is 250ms, the highest it can go is 2128 - 1. Defaults to 1000ms, and lower values may take more resources due to more frequent polling of data, and may be less accurate in some circumstances. -
-l,--left_legendwill move external table legends to the left side rather than the right side. Right side is default. -
-u,--current_usagewill make a process' CPU usage be based on the current total CPU usage, rather than assuming 100% CPU usage. Only affects Linux for now. -
g,--groupwill group together processes with the same name by default (equivalent to pressingTab).
Keybindings
General
-
q,Ctrl-cto quit. Note if you are currently in the search widget,qwill not work so you can still type. -
Ctrl-rto reset the screen and reset all collected data. -
fto freeze the screen from updating with new data. Pressfagain to unfreeze. Note that monitoring will still continue in the background. -
Ctrl-UporCtrl-k,Ctrl-DownorCtrl-j,Ctrl-LeftorCtrl-h,Ctrl-RightorCtrl-lto navigate between widgets. -
Escto close a dialog window. -
?to get a help screen explaining the controls. Note all controls exceptEscto close the dialog will be disabled while this is open.
Scrollable Tables
-
UporkandDownorjscrolls through the list if the widget is a table (Temperature, Disks, Processes). -
ggorHometo jump to the first entry of the current table. -
G(Shift-g) orEndto jump to the last entry of the current table.
Processes
-
ddto kill the selected process -
cto sort by CPU usage. Sorts in descending order by default. Press again to reverse sorting order. -
mto sort by memory usage. Sorts in descending order by default. Press again to reverse sorting order. -
pto sort by PID. Sorts in ascending order by default. Press again to reverse sorting order. -
nto sort by process name. Sorts in ascending order by default. Press again to reverse sorting order. -
Tabto group together processes with the same name. Disables PID sorting.ddwill now kill all processes covered by that name. -
Ctrl-for/to open the search widget.
Search Widget
-
Ctrl-porCtrl-nto switch between searching for PID and name respectively. -
EscorCtrl-fto close.
Note that q is disabled while in the search widget.
Mouse actions
- Scrolling with the mouse will scroll through the currently selected list.

