| .github/ISSUE_TEMPLATE | ||
| assets | ||
| src | ||
| tests | ||
| .gitignore | ||
| .markdownlint.json | ||
| .travis.yml | ||
| Cargo.toml | ||
| LICENSE | ||
| README.md | ||
| rustfmt.toml | ||
bottom
A graphical top clone, written in Rust. Inspired by both gtop and gotop
Features
Features of bottom include:
-
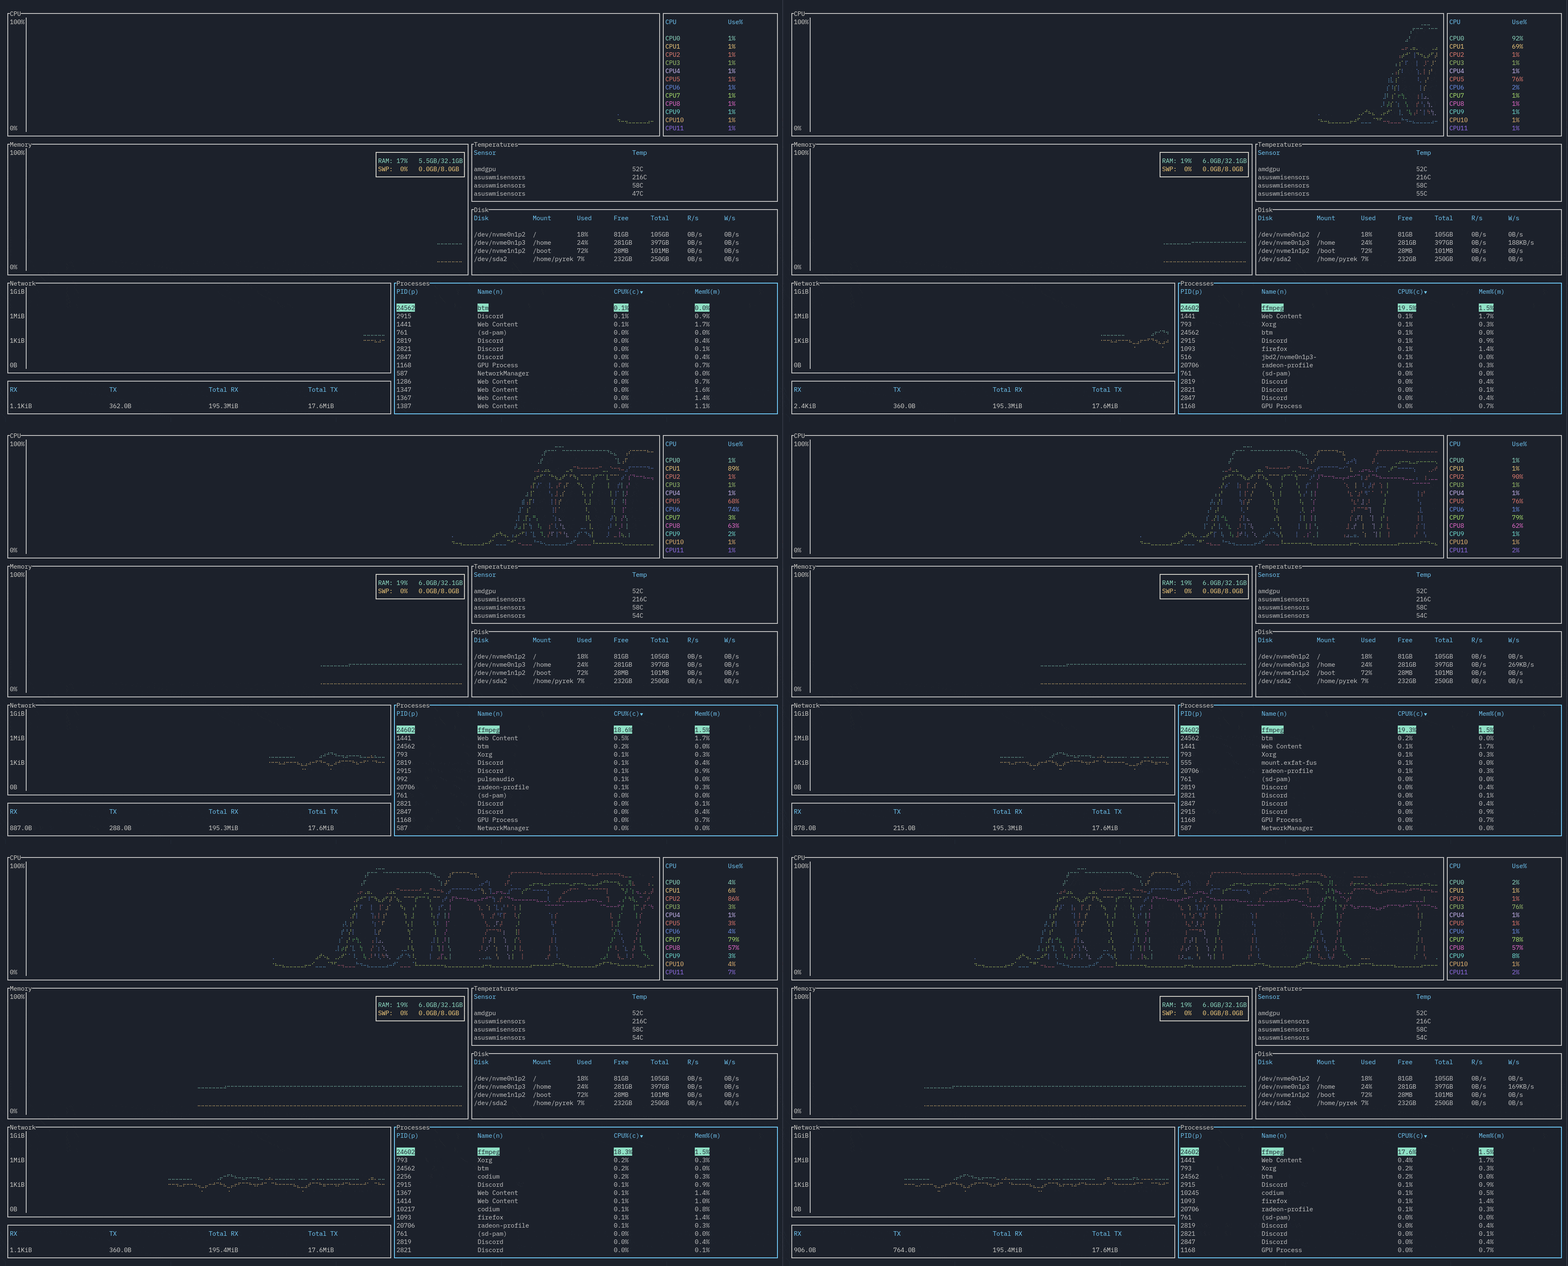
CPU widget to show a visual representation of per-core usage. Average CPU display also exists.
-
Memory widget to show a visual representation of both RAM and SWAP usage.
-
Networks widget to show a log-based visual representation of network usage.
-
Sortable and searchable process widget. Searching supports regex, and you can search by PID and process name.
-
Disks widget to display usage and I/O per second.
-
Temperature widget to monitor detected sensors in your system.
The compatibility of each widget and operating systems are, as of version 0.1.0, as follows:
| OS/Widget | CPU | Memory | Disks | Temperature | Processes | Networks |
|---|---|---|---|---|---|---|
| Linux (tested on Arch Linux) | ✓ | ✓ | ✓ | ✓ | ✓ | ✓ |
| Windows (tested on Windows 10) | ✓ | ✓ | ✓ | Currently not working | ✓ | Partially supported (total RX/TX unavailable) |
| macOS | Untested | Untested | Untested | Untested | Untested | Untested |
Installation
In all cases you can install the in-development version by cloning and using cargo build --release. Note this is built and tested with Rust Stable (1.40.0 as of writing). You can also get release versions using cargo install bottom, or manually building from the Releases page by downloading and building.
Linux
Other installation methods based on distros are as follows:
Arch Linux
You can get the release versions from the AUR by installing bottom.
Windows
You may need to install a font like FreeMono and use a terminal like cmder for font support to work properly, unfortunately.
macOS
macOS support will hopefully come soonTM. I've had reports of it working already, but I cannot personally confirm whether things are working until then.
Usage
Run using btm.
Command line options
-
-h,--helpshows the help screen and exits. -
-a,--avgcpuenables also showing the average CPU usage in addition to per-core CPU usage. -
-m,--dot-markeruses a dot marker instead of the default braille marker. -
-c,--celsiusdisplays the temperature type in Celsius. This is the default. -
-f,--fahrenheitdisplays the temperature type in Fahrenheit. -
-k,--kelvindisplays the temperature type in Kelvin. -
-v,--versiondisplays the version number and exits. -
-d,--debugenables debug logging. -
-r <RATE>,--rate <RATE>will set the refresh rate in milliseconds. Lowest it can go is 250ms, the highest it can go is 2128 - 1. Defaults to 1000ms, and lower values may take more resources due to more frequent polling of data, and may be less accurate in some circumstances. -
-l,--left_legendwill move external table legends to the left side rather than the right side. Right side is default. -
-u,--current_usagewill make a process' CPU usage be based on the current total CPU usage, rather than assuming 100% CPU usage. Only affects Linux for now. -
-g,--groupwill group together processes with the same name by default (equivalent to pressingTab). -
-i,--case_insensitivewill default to not matching case
when searching processes.
Keybindings
General
-
q,Ctrl-cto quit. Note if you are currently in the search widget,qwill not work so you can still type. -
Ctrl-rto reset the screen and reset all collected data. -
fto freeze the screen from updating with new data. Pressfagain to unfreeze. Note that monitoring will still continue in the background. -
Ctrl-UporCtrl-k,Ctrl-DownorCtrl-j,Ctrl-LeftorCtrl-h,Ctrl-RightorCtrl-lto navigate between widgets. -
Escto close a dialog window. -
?to get a help screen explaining the controls. Note all controls exceptEscto close the dialog will be disabled while this is open.
Scrollable Tables
-
UporkandDownorjscrolls through the list if the widget is a table (Temperature, Disks, Processes). -
ggorHometo jump to the first entry of the current table. -
G(Shift-g) orEndto jump to the last entry of the current table.
Processes
-
ddto kill the selected process -
cto sort by CPU usage. Sorts in descending order by default. Press again to reverse sorting order. -
mto sort by memory usage. Sorts in descending order by default. Press again to reverse sorting order. -
pto sort by PID. Sorts in ascending order by default. Press again to reverse sorting order. -
nto sort by process name. Sorts in ascending order by default. Press again to reverse sorting order. -
Tabto group together processes with the same name. Disables PID sorting.ddwill now kill all processes covered by that name. -
Ctrl-for/to open the search widget.
Search Widget
-
Ctrl-porCtrl-nto switch between searching for PID and name respectively. -
Ctrl-sto toggle between a simple search and a regex search. -
Ctrl-aandCtrl-eto jump to the start and end of the search bar respectively. -
EscorCtrl-fto close. -
LeftandRightarrow keys to move the cursor within the search bar.
Note that q is disabled while in the search widget.
Mouse actions
- Scrolling with the mouse will scroll through the currently selected list if the widget is a scrollable table.

