| .dependabot | ||
| .github/ISSUE_TEMPLATE | ||
| ansibleplaybookgrapher | ||
| img | ||
| tests | ||
| .gitignore | ||
| .travis.yml | ||
| CHANGELOG.md | ||
| LICENSE | ||
| Makefile | ||
| MANIFEST.in | ||
| README.md | ||
| requirements.txt | ||
| setup.cfg | ||
| setup.py | ||
| test_install.sh | ||
Ansible Playbook Grapher

![]()
![]()
ansible-playbook-grapher is a command line tool to create a graph representing your Ansible playbook tasks and roles. The aim of this project is to quickly have an overview of your playbook.
Inspired by Ansible Inventory Grapher.
Prerequisites
-
Ansible >= 2.8: The script has not been tested with an earlier version of Ansible, some features may not work. If you still use an older version of Ansible, create an virtual environment and install ansible-playbook-grapher.
pip installwill install a version of Ansible >= 2.8 -
graphviz: The tool used to generate the graph in SVG.
$ sudo apt-get install graphviz # or yum install or brew install
Installation
$ pip install ansible-playbook-grapher
Usage
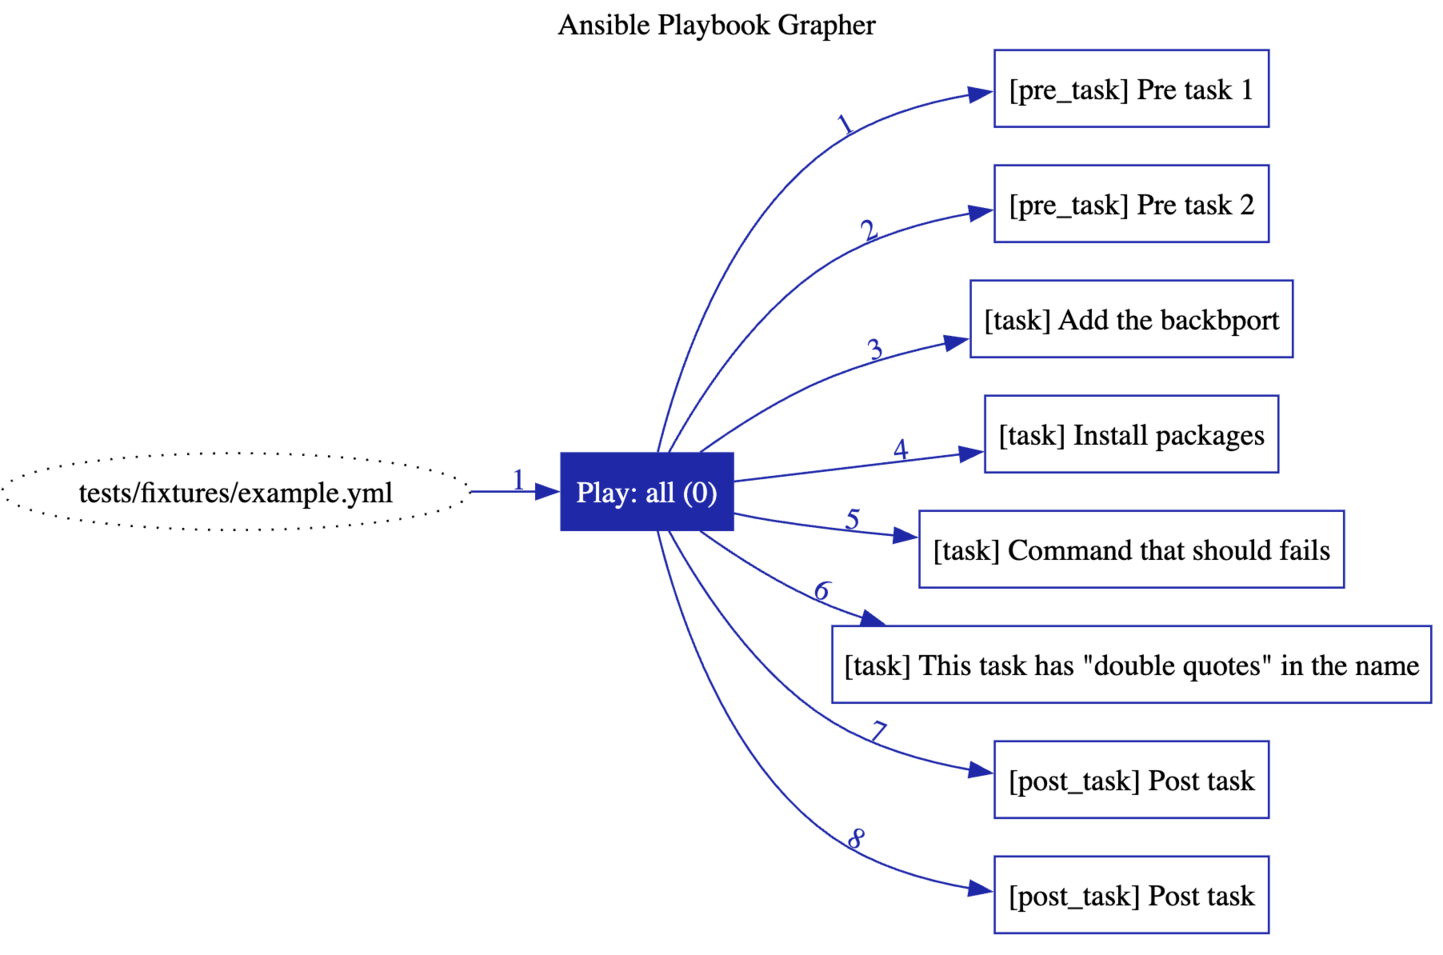
$ ansible-playbook-grapher tests/fixtures/example.yml
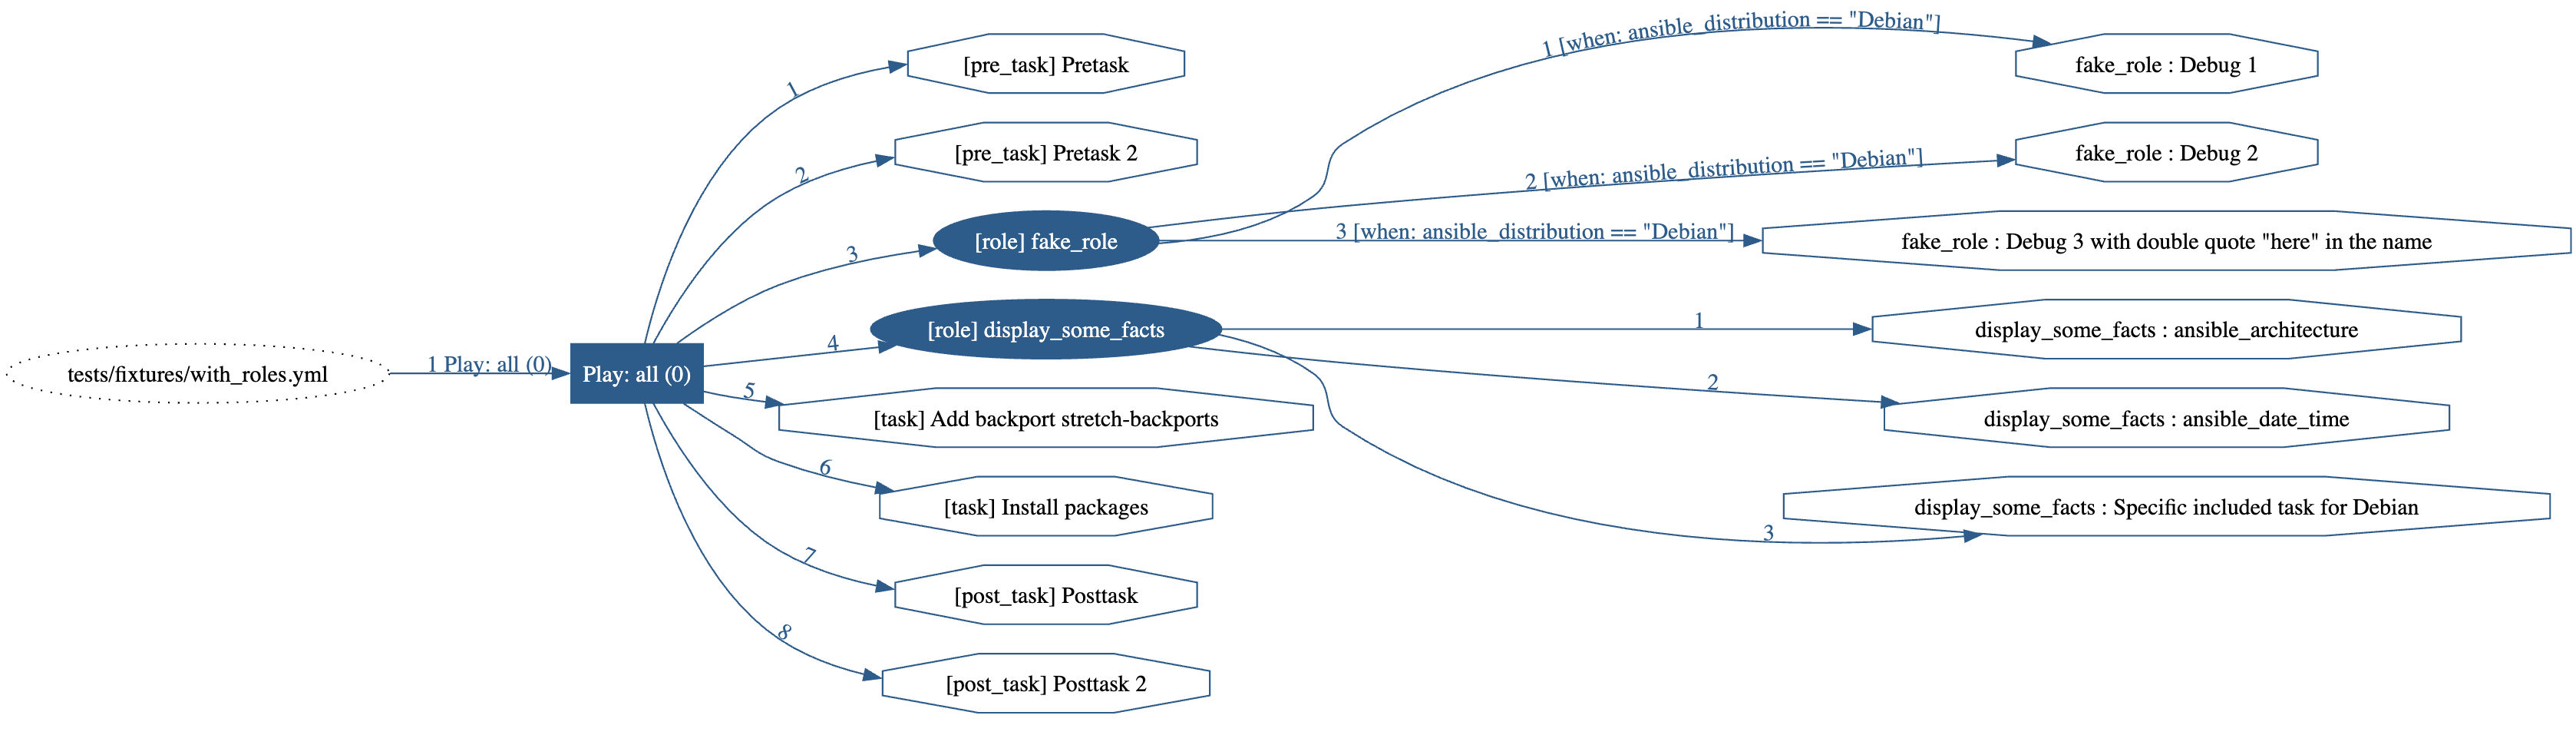
$ ansible-playbook-grapher --include-role-tasks tests/fixtures/with_roles.yml
Some options are available:
$ ansible-playbook-grapher --help
usage: ansible-playbook-grapher [-h] [-v] [-i INVENTORY]
                                [--include-role-tasks] [-s]
                                [-o OUTPUT_FILENAME] [--version] [-t TAGS]
                                [--skip-tags SKIP_TAGS] [--vault-id VAULT_IDS]
                                [--ask-vault-pass | --vault-password-file VAULT_PASSWORD_FILES]
                                [-e EXTRA_VARS]
                                playbook

Make graphs from your Ansible Playbooks.

positional arguments:
  playbook              Playbook to graph

optional arguments:
  --ask-vault-pass      ask for vault password
  --include-role-tasks  Include the tasks of the role in the graph.
  --skip-tags SKIP_TAGS
                        only run plays and tasks whose tags do not match these
                        values
  --vault-id VAULT_IDS  the vault identity to use
  --vault-password-file VAULT_PASSWORD_FILES
                        vault password file
  --version             show program's version number and exit
  -e EXTRA_VARS, --extra-vars EXTRA_VARS
                        set additional variables as key=value or YAML/JSON, if
                        filename prepend with @
  -h, --help            show this help message and exit
  -i INVENTORY, --inventory INVENTORY
                        specify inventory host path or comma separated host
                        list.
  -o OUTPUT_FILENAME, --ouput-file-name OUTPUT_FILENAME
                        Output filename without the '.svg' extension. Default:
                        <playbook>.svg
  -s, --save-dot-file   Save the dot file used to generate the graph.
  -t TAGS, --tags TAGS  only run plays and tasks tagged with these values
  -v, --verbose         verbose mode (-vvv for more, -vvvv to enable
                        connection debugging)
Configuration: ansible.cfg
The content of ansible.cfg is loaded automatically when running the grapher according to Ansible's behavior. The
corresponding environment variables are also loaded.
The values in the config file (and their corresponding environment variables) may affect the behavior of the grapher.
For example TAGS_RUN and TAGS_SKIP or vault configuration.
More information here.
Contribution
Contributions are welcome. Feel free to contribute by creating an issue or submitting a PR 😃
Dev environment
To setup a new development environment :
- Install graphviz
sudo apt-get install graphviz # or yum install or brew install graphviz - (cd tests && pip install -r requirements_tests.txt)
Run the tests with:
$ make test # run all tests
The graphs are generated in the folder tests/generated_svg.
TODO
- Graphviz : properly rank the edge of the graph to represent the order of the execution of the tasks and roles
- Graphviz : find a way to avoid or reduce edges overlapping