| .github | ||
| ansibleplaybookgrapher | ||
| img | ||
| tests | ||
| .gitignore | ||
| CHANGELOG.md | ||
| LICENSE | ||
| Makefile | ||
| MANIFEST.in | ||
| README.md | ||
| requirements.txt | ||
| setup.cfg | ||
| setup.py | ||
| test_install.sh | ||
Ansible Playbook Grapher
![]()
![]()
![]()
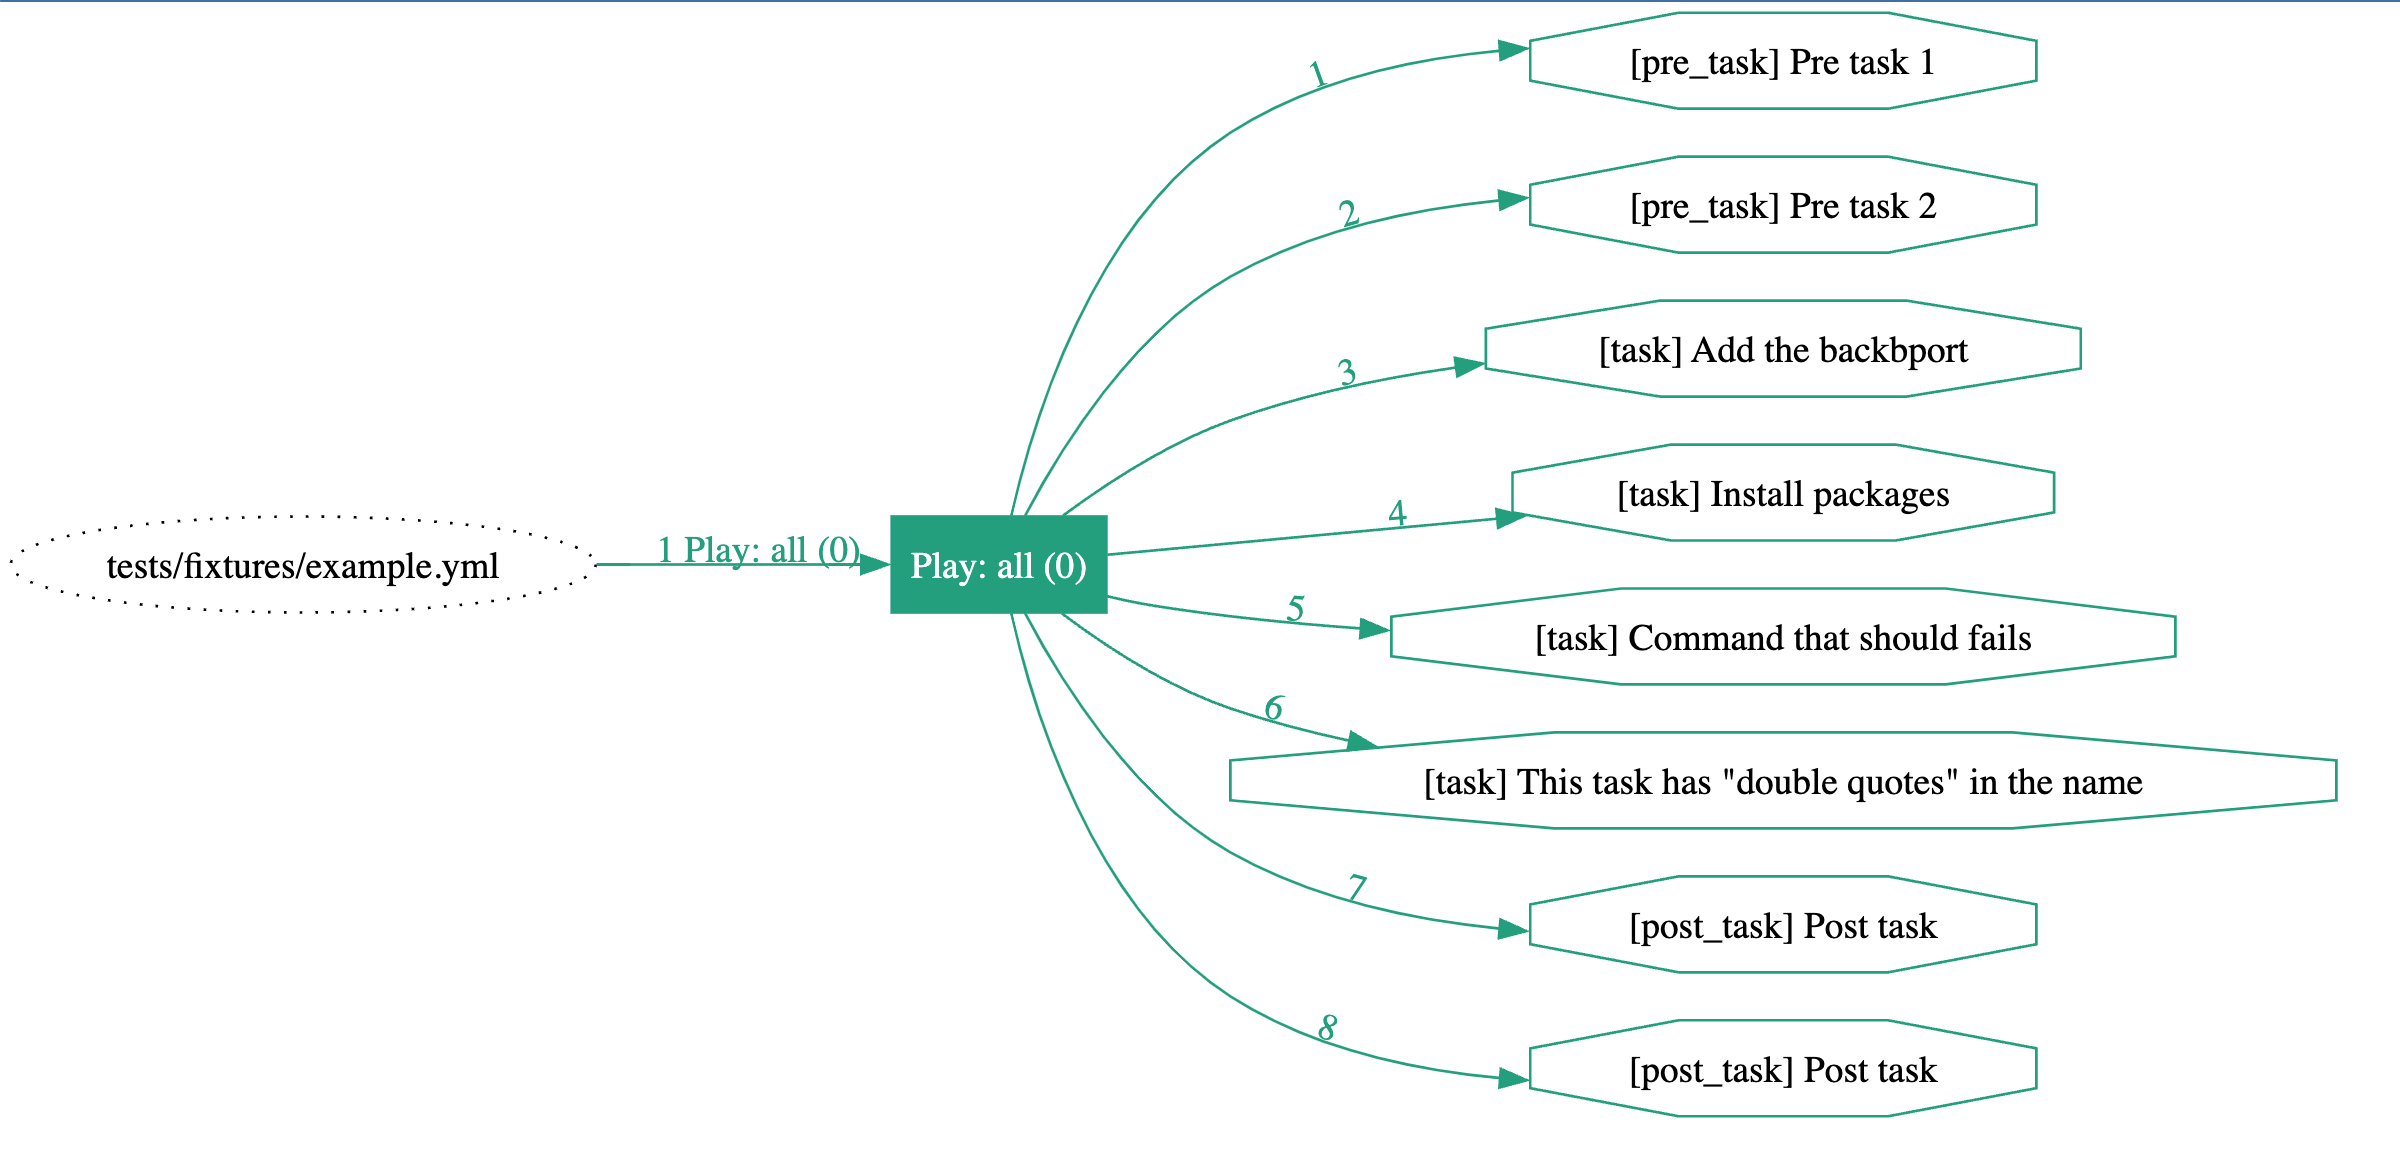
ansible-playbook-grapher is a command line tool to create a graph representing your Ansible playbook plays, tasks and roles. The aim of this project is to have an overview of your playbook.
Inspired by Ansible Inventory Grapher.
Prerequisites
- Python 3
- Ansible >= 2.9: If you still use an older version of Ansible, create a virtual environment and install ansible-playbook-grapher. pip will install a version of Ansible >= 2.9 if not already installed. I try to respect Red Hat Ansible Engine Life Cycle for the supported Ansible version.
- Graphviz: The tool used to generate the graph in SVG.
$ sudo apt-get install graphviz # or yum install or brew install
Installation
$ pip install ansible-playbook-grapher
Usage
ansible-playbook-grapher tests/fixtures/example.yml
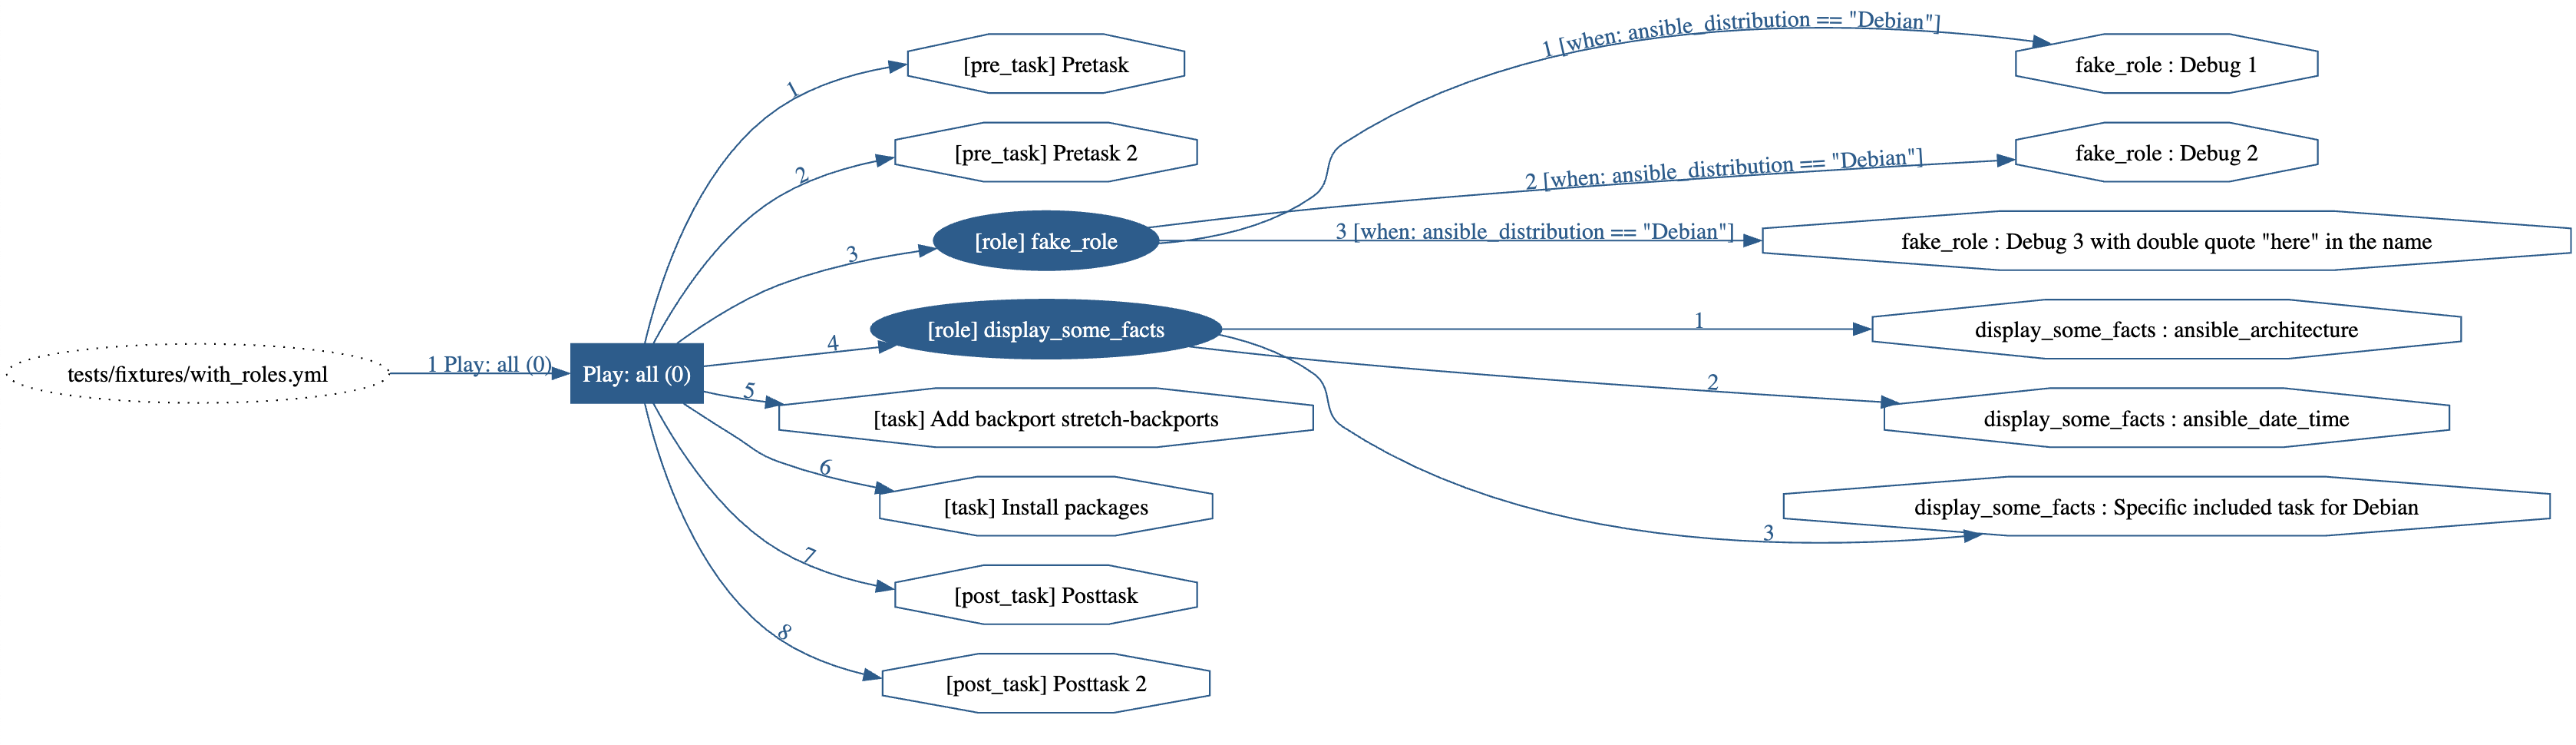
ansible-playbook-grapher --include-role-tasks tests/fixtures/with_roles.yml
ansible-playbook-grapher tests/fixtures/with_block.yml
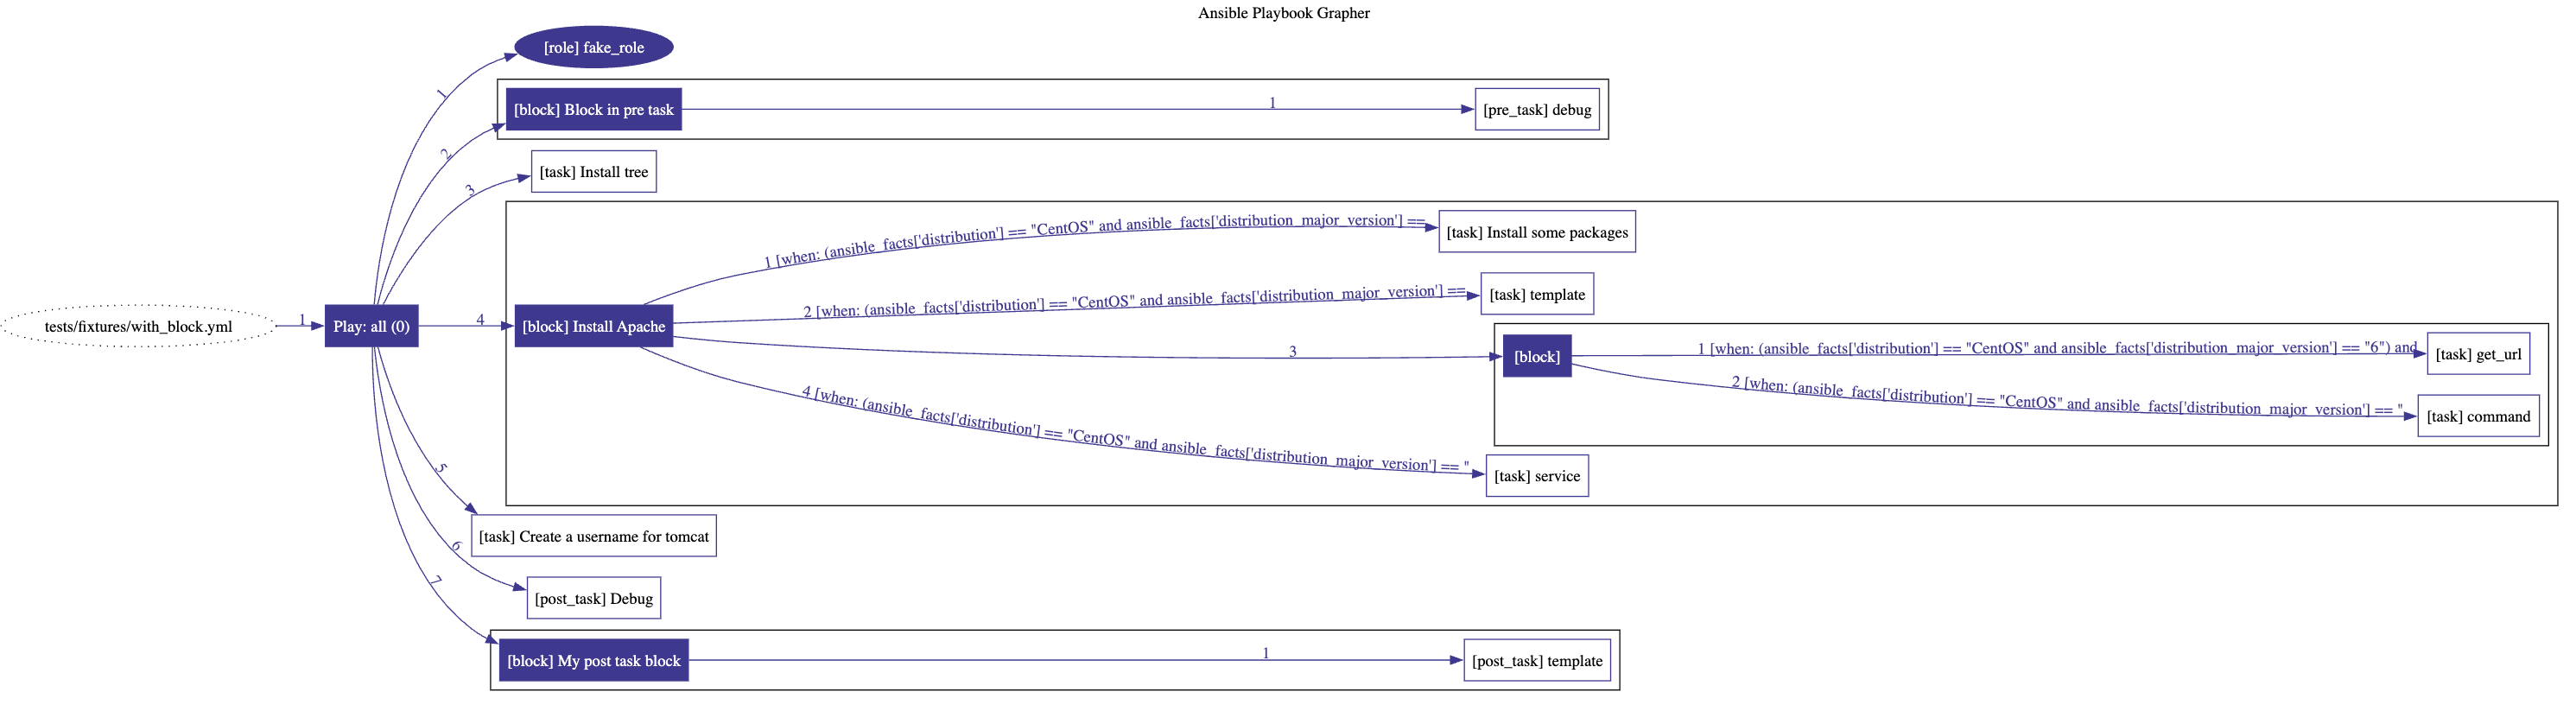
Note on block: Since blocks are logical group of tasks, the conditional when is not displayed on the edges pointing
to them but on the tasks inside the block. This
mimics Ansible behavior
regarding the blocks.
CLI options
The available options:
$ ansible-playbook-grapher --help
usage: ansible-playbook-grapher [-h] [-v] [-i INVENTORY]
                                [--include-role-tasks] [-s] [--view]
                                [-o OUTPUT_FILENAME] [--version] [-t TAGS]
                                [--skip-tags SKIP_TAGS] [--vault-id VAULT_IDS]
                                [--ask-vault-pass | --vault-password-file VAULT_PASSWORD_FILES]
                                [-e EXTRA_VARS]
                                playbook

Make graphs from your Ansible Playbooks.

positional arguments:
  playbook              Playbook to graph

optional arguments:
  --ask-vault-pass      ask for vault password
  --include-role-tasks  Include the tasks of the role in the graph.
  --skip-tags SKIP_TAGS
                        only run plays and tasks whose tags do not match these
                        values
  --vault-id VAULT_IDS  the vault identity to use
  --vault-password-file VAULT_PASSWORD_FILES
                        vault password file
  --version             show program's version number and exit
  --view                Automatically open the resulting SVG file with your
                        system’s default viewer application for the file type
  -e EXTRA_VARS, --extra-vars EXTRA_VARS
                        set additional variables as key=value or YAML/JSON, if
                        filename prepend with @
  -h, --help            show this help message and exit
  -i INVENTORY, --inventory INVENTORY
                        specify inventory host path or comma separated host
                        list.
  -o OUTPUT_FILENAME, --output-file-name OUTPUT_FILENAME
                        Output filename without the '.svg' extension. Default:
                        <playbook>.svg
  -s, --save-dot-file   Save the dot file used to generate the graph.
  -t TAGS, --tags TAGS  only run plays and tasks tagged with these values
  -v, --verbose         verbose mode (-vvv for more, -vvvv to enable
                        connection debugging)
Configuration: ansible.cfg
The content of ansible.cfg is loaded automatically when running the grapher according to Ansible's behavior. The
corresponding environment variables are also loaded.
The values in the config file (and their corresponding environment variables) may affect the behavior of the grapher.
For example TAGS_RUN and TAGS_SKIP or vault configuration.
More information here.
Contribution
Contributions are welcome. Feel free to contribute by creating an issue or submitting a PR 😃
Dev environment
To setup a new development environment :
- Install graphviz
sudo apt-get install graphviz # or yum install or brew install graphviz - (cd tests && pip install -r requirements_tests.txt)
Run the tests and open the generated files in your system’s default viewer application:
export TEST_VIEW_GENERATED_FILE=1
$ make test # run all tests
The graphs are generated in the folder tests/generated_svg. They are also generated as artefacts
in Github Actions. Feel free to look at them when
submitting PRs.