| README.md | ||
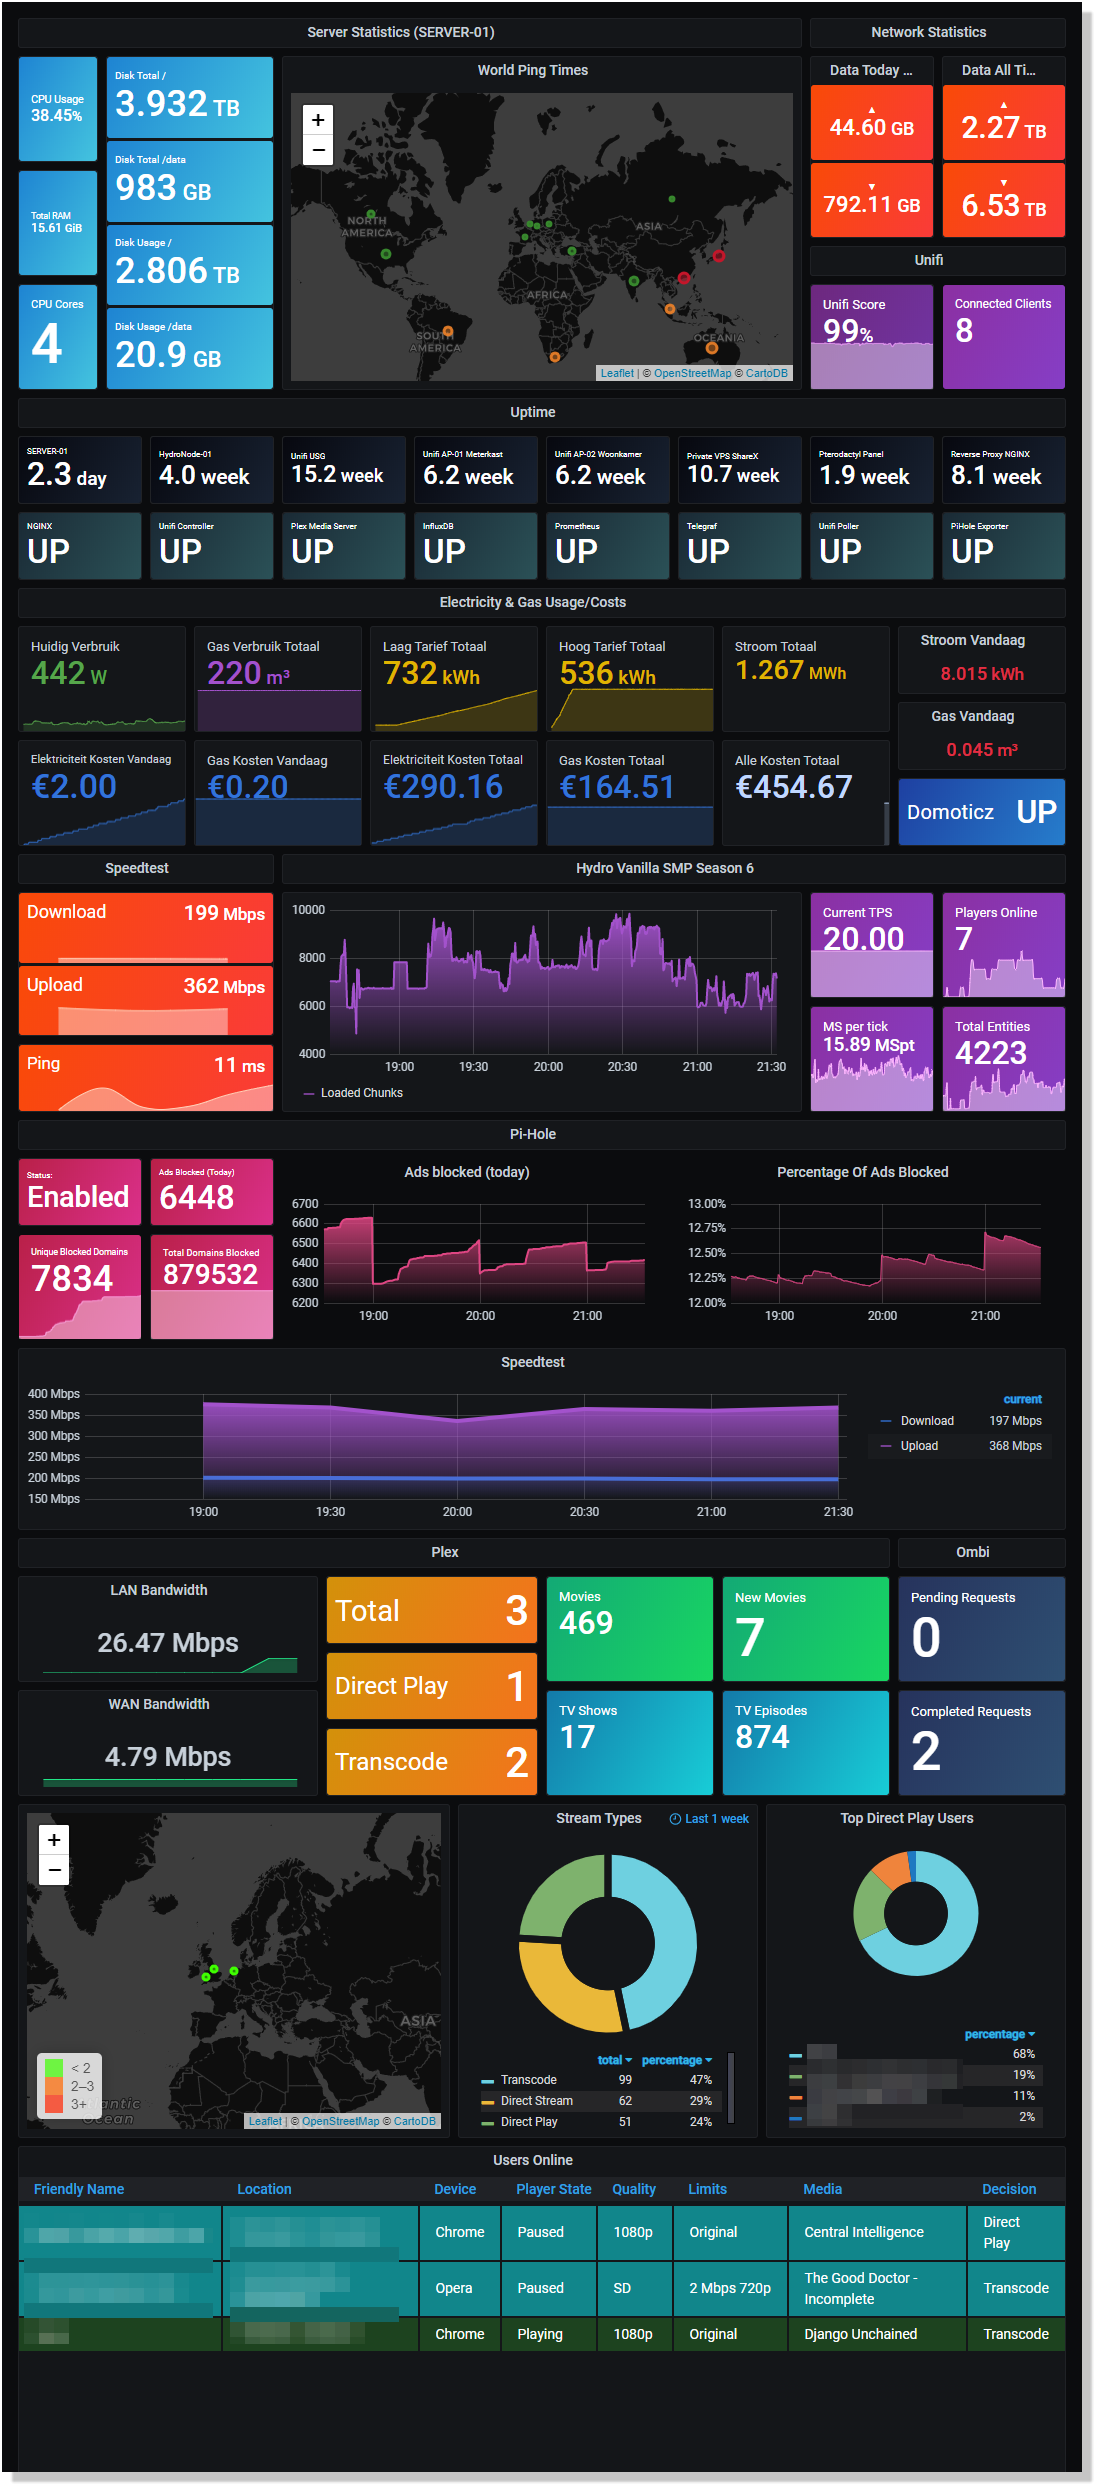
Grafana Home Dashboard
 A requested Github Repo for my Grafana Home Dashboard
To Start
Even though my Grafana Dashboard itself looks pretty and all, my entire setup is a complete mess to be fair. This is my first time ever really screwing around with Grafana and just seeing what I could do with it. Most of this stuff is ran off of my old gaming rig that I installed with Debian and have running as a home server. Next to that I have a few PI's for stuff like Domoticz, and Pi-Hole.
Before I started on this I had no knowledge of antything like Docker of Proxmox, so all of this stuff is just ran on a single box, without any shielding, containerizing or virtualisation. I know that's probably a blasphemy, but I already have plans for a new home server on which I this time will use something like Docker or Proxmox.
Below I've posted all the information and links to what I've used to set this up, I hope I can interest others to start using Grafana. Enjoy!